Quantcast

Biden Administration Confirms Canadian and Mexican Truck Drivers Must Show Vaccination Passport Beginning Tomorrow

The preparation window has closed.

Given the destabilized and tenuous nature of the current supply chain, many people wondered if the Biden administration would actually be stupid enough to follow through with a truck driver vaccination mandate.  The answer is yes.  Please conduct yourselves accordingly.


The Department of Homeland Security (DHS) updated their guidance yesterday [LINK HERE] and put a hard date of tomorrow, January 22nd, for the trucker vaccine mandate at all border crossings and ferry terminals.   Canada put the vaccine mandate into effect last week, January 15th.

[Dept. of Homeland Security] – [..]  “Starting on January 22, 2022, the Department of Homeland Security will require that non-U.S. individuals entering the United States via land ports of entry or ferry terminals along our Northern and Southern borders be fully vaccinated against COVID-19 and be prepared to show related proof of vaccination,” said Secretary Alejandro N. Mayorkas. “These updated travel requirements reflect the Biden-Harris Administration’s commitment to protecting public health while safely facilitating the cross-border trade and travel that is critical to our economy.”

These changes – which were first announced in October 2021 and made in consultation with the White House and several federal agencies, including the Centers for Disease Control and Prevention (CDC) – will align public health measures that govern land travel with those that govern incoming international air travel.

Non-U.S. individuals traveling to the United States via land ports of entry or ferry terminals, whether for essential or non-essential reasons, must:

(more…)

December Report from Long Beach Shows Port Handling Less Cargo in December Than When Biden Announced Expanded Port Operations

When Joe Biden took to the microphones in October to announce, “a series of public and private commitments to move more goods faster, and strengthen the resiliency of our supply chains, by moving towards 24/7 operations at the Ports of Los Angeles and Long Beach,” the supply chain objective was to increase the productivity of the ports.  However, data released for November [SEE HERE] and now December, show exactly the opposite.

Transportation Secretary Pete Buttigieg visited both ports recently.  Both ports, along with Oakland, also made the arriving ships remain further offshore than when the October announcement was made.  They are hiding the ships.

For some unknown reason the Port of Los Angeles (POLA) has delayed reporting of December; but the Port of Long Beach (POLB) just released their data {LINK}.  What the statistics show is that less cargo is being handled now, than it was when the 24/7 port operations announcement was made:

The purpose of telling the ships to await their port time in a queue farther offshore is transparent.  The Biden administration wants to give the illusion they eliminated the bottleneck of container ships.   Out of sight is out of mind.

Operation ‘Hide the Ships’ allows the administration to make claims about port efficiencies and increased productivity that are abjectly false.  The data from the two months after the announcement shows less container offloading and onloading happened in November and December than happened in the prior month of October when the new initiatives were announced.

(more…)

Consumer Inflation Reaches 7 Percent in December, Highest Rate in Forty Years and Still Climbing

The Bureau of Labor Statistics (BLS) released the December inflation data today [DATA HERE] for December.  Readers on these pages are not surprised to discover that inflation in the U.S. economy has now reached a forty year high at 7 percent.  {Go Deep}

Unfortunately, the 7% in June of 1982 was when inflation was on the way down from Jimmy Carter’s failed economic policy.  This time our 7% milestone has been achieved while inflation is on the climb thanks to Joe Biden’s failed economic policies.

Carter’s mess was created by regulation, policies and oil prices.  Biden’s mess is created by the same and much more.

Yes, it will be getting worse.

That weird picture with the Bidens and the Carters comes to mind.  The scale within the picture is appropriate when considering inflation and what is to come.  Biden’s inflation is much larger than Carter’s.

As you know, the top line number of 7% is a false premise.  We are feeling much, much higher overall prices in our lives with gasoline, home heating fuel, electricity costs, housing and the astronomical prices at the grocery store.  The BLS data is backward looking, meaning it was compiled in early December 2021 for comparison to December 2020.  Where we are CURRENTLY is much worse than where we were in early December.

We are feeling the front side of the inflation hurricane right now. The consumer prices at end of January and through February are now reflecting new purchase order prices and contract prices to wholesalers, buyers and retailers.  The higher energy costs, fuel costs, warehousing costs, transportation costs and delivery costs are cumulative. As a result, the December report is simply the precursor to what will be much more damaging inflation data in Feb (showing this month) and March (showing Feb).

Additionally, the BLS data captured gas prices at their slight drop from oil prices in late November and early December.  The price of oil has now gone even higher, and the price of gasoline is once again on the rise.  We have not yet seen the worst of this folks.  Hopefully most are prepared.

I modified BLS Table-1, taking out some of the noise, to give the snapshot of how the bureau is compiling data:

(more…)

They Know What’s Coming, White House Prepares for Terrible December Inflation Data with Prepared Script

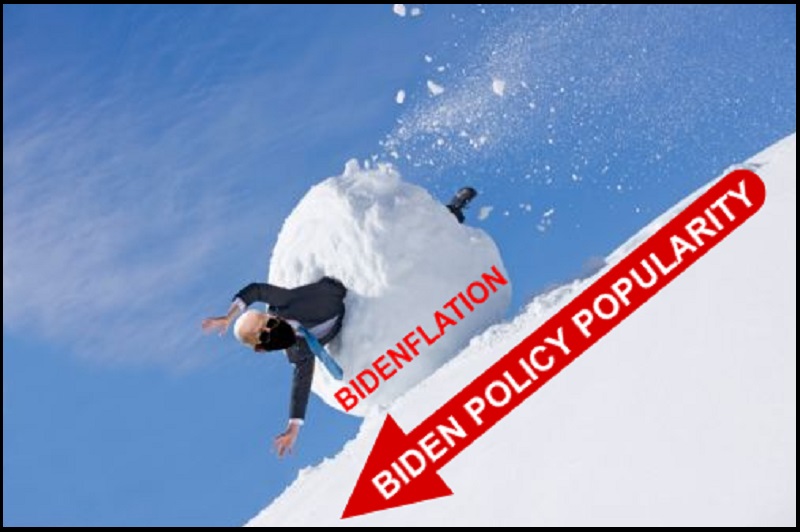
The snowball effect of cumulative inflation is going to be on display tomorrow when the BLS inflation data from December is released.  We have previously discussed the unavoidable price increases as noted within the November data Here, and within the producer price data Here.

While the data being released tomorrow is backward looking, we are in the eye of the inflation storm right now.  The consumer prices at end of January and through February are all reflecting new purchase order prices and contract prices to wholesalers, buyers and retailers.   As a result, the December reports will be the precursor to what will be much more damaging data in Feb and March.

White House spokesperson Jen Psaki began trying to get ahead of the consumer price release with a short briefing to the traveling press pool earlier today.  A short audio-only soundbite reflects the political problem the White House knows they will soon be dealing with. LISTEN:

(more…)

Things to Look For…

Things that seem disconnected but aren’t.  The thirteen bullet points below are the issues we will first notice as the general food supply chain begins show signs of vulnerability.  This outline explains why it is happening and how long it can be expected.

In the previous October, November and December warnings we emphasized preparation and counted down the 90-day window.  Now, as we enter the final two weeks before mid/late January, the date of our original prediction, it appears that some media are starting to catch up and the larger public is starting to notice.   [NOTE: We nailed the timeline almost to the week]

Feel free to note in the comments section what is happening in your area.  Hopefully, most of us are much better positioned than the average person who has not been following this as closely over the past several months.

Initial food instability signs in the supply chain.  Things to look for: 

(1) A shortage of processed potatoes (frozen specifically).

And/Or a shortage of the ancillary products that are derivates of, or normally include, potatoes.

(2) A larger than usual footprint of turkey in the supermarket (last line of protein).

(3) A noticeable increase in the price of citrus products.

(4) A sparse distribution of foodstuffs that rely on flavorings.

(5) The absence of non-seasonal products.

(6) Little to no price difference on the organic comparable (diff supply chain)

(7) Unusual country of origin for fresh product type.

(more…)

Lower Than Expected November Retail Sales Shows Inflation Impact and Reduction in Consumer Spending

The Commerce Department November retail sales data was release today [DATA HERE] – [DETAIL pdf HERE].  The top line issue is a shocking drop in retail sales for November in key categories that align with previous discussion of inflation spending priorities for all U.S. consumers.

Before getting to the data, one point is critical to remember.  The commerce department sales figures are based on dollars spent. This point is important, because the items being purchased have inflation within them.  When prices are higher due to inflation, sales figures should be higher due to higher prices.  Ex. If there is an 8% increase in retail price, but only a 4% increase in retail sales, that means less stuff is being sold.  [Less units sold at a higher price gives the illusion of an increase in sales.]

Despite the start of the traditional holiday sales and shopping period, the total sales growth in November was 0.3% over October [Column A].  Factoring in inflation during the same month to month comparison at 0.9%, you can tell that overall in November there was a drop in units sold across the total of retail sales outlets.

A drop in sales at a time when holiday shopping should be taking place is concerning.  However, the sales reality aligns with the employment data last week showing a drop of 20,000 workers in the retail sector for November.  Put them together, and the picture shows retailers did not need employees, because consumers are not spending.

If we look deeper into the November sales figures, we can see that a contraction in discretionary spending is the primary issue. Electronics (-4.6%), Department Stores (-5.4%) and even online sales at ZERO.  We can also see a direct correlation in comparative inflation impact within the sales data for November 2021 when compared to November 2020 [Column B].

(more…)

November Producer Prices Rise Record Breaking 9.6 Percent Year Over Year, Biggest Single Month in History, as Massive Inflation Builds Within The Supply Chain – Again, No Signs of Slowing Down

We said it was happening {Go Deep}, and it is.  Last month CTH put the preparation window at 60 days +/- depending on region.  That window is now around 30 days before the next spike in inflation shows up from cumulative costs snowballing throughout the supply chain. The “producer price index” is essentially the tracking of wholesale prices at three stages: Origination (commodity), Intermediate and Final.

The final product inflation rate in July (reported in August) was alarming at 7.8%. However, we warned it would get worse. The Bureau of Labor and Statistics (BLS) then released stunning price data for October [DATA Here], showing an even more dramatic 8.6% price increase in final demand. More intense warnings shared.

Today, we get the November BLS Result [DATA Here], and unfortunately the results are showing what was expected.  The cumulative costs of massive increases in energy prices are building into the supply at an astonishing rate.  The November data shows a rate of wholesale final goods inflation at 9.6%, the largest single month comparative rate increase in history.

The bureau even went back and revised/increased the August price index from 7.8 to 8.4 percent, and revised/increased the October figure from 8.6 to 8.8 percent.  The average monthly price increase is almost a full percent… every month.  It looks like the BLS backward revisions are an attempt to smooth down the rate of increase.

(BLS) – “The Producer Price Index for final demand increased 0.8 percent in November, seasonally adjusted, the U.S. Bureau of Labor Statistics reported today. Final demand prices moved up 0.6 percent in each of the 3 prior months. (See table A.) On an unadjusted basis, the final demand index rose 9.6 percent for the 12 months ended in November, the largest advance since 12-month data were first calculated in November 2010.” (more)

I modified Table A (final demand product pricing), taking out some of the noise to make it a little easier to see the big picture of what is happening.

When you see the wholesale level of prices almost double the increase in consumer level inflation rate, you can predict that consumer prices will likely go even higher.  Future finished goods, at a retail level, will carry the current wholesale price increase.

Stuff costs a lot now… and because the inbound stuff to make the finished goods is still climbing in price…. stuff is about to cost even more.   You can see this in the inflation rate of intermediate goods which I have highlighted below.

(more…)

Sunday Talk Warning, Mohamed El-Erian Concedes His Economic Views Are Now Contingent Upon Climate Change Driving Policy

Well, there’s another “economist” who can be set into the folder of ‘no longer useful’.  During his appearance today on CBS Face The Nation, Mohamed El-Erian, chief economic adviser for Allianz, finishes his segment by revealing his underlying precept: Climate Change policy is now the economic policy driver of all his investment advice.

Within the interview, El-Erian said the “characterization of inflation as transitory is probably the worst inflation call in the history of the Federal Reserve.”  Additionally, El-Erian said inflation is likely to remain high into the next year and perhaps beyond.  Unfortunately, other than those two points of generally well educated accuracy, everything else is wrapped up in the political correctness of climate change…. which, you don’t really discover until the very end of the interview. WATCH:

The baseline for El-Erian saying the Build Back Better spending fiasco is a good thing, is based on accepting the pretense that massive amounts of federal spending will be needed to structurally change the U.S. economy from fossil fuel use to the Green New Deal.   If you do not believe in this transformation, there is no merit to any component of the BBB spending proposal. It really is that simple.

As a consequence, El-Erian is staking the position that climate change agenda politics is now the focal point from which all other economic policy will be determined.  He has conceded in his mind and worldview, perhaps based on his associations and peer discussions, that any forward economic analysis must therefore establish itself from the alternative fuel position.

(more…)

MAGAnomics vs JoeBamanomics, a Simple to Understand Graphic

President Trump economic policy -vs- Joe Biden economic policy

When wages (blue line) are above inflation (red line) our income is growing, life is good and the working class has more disposable income to enjoy life.  However, when wages (blue line) are lower than inflation (red line) our income is shrinking, life is a struggle and the working class has less disposable income to enjoy life.

♦ Point One – Nothing happens accidentally. The road to a “service-driven economy” is paved with a great disparity between financial classes. The wealth gap is directly related to the inability of the middle class to thrive.

♦ Point Two – There is nothing of value behind the obtuse term “service-driven economy.” The multinationals are paying for this administration, just like they paid the Obama administration; paying for economic policy that advances their interests.  Congress goes along with the K-Street demands, because Wall Street is now the primary benefactor of legislative intent. Nothing about their effort is done with American interests in mind.

To go deep, keep reading.

(more…)

Clueless Joe Says Federal Spending Doesn’t Increase Inflation, Reality Begs to Differ

At the most troubling level, Joe Biden believes what people tell him to say for the reason they tell him to say it.  This reality underscores the reason why Barack Obama’s network selected Biden as their disposable front man in 2020.  Biden sounds convinced, because Biden is convinced.  He’s wrong, factually and fundamentally wrong, but he believes what he repeats in public.

The most painfully obvious examples of this dynamic are present when Joe Biden explains economic things based on what other people have told him.  The guy really is the modern personification of the naked emperor parading around to show off an invisible coat that he genuinely believes he’s wearing. The self-deception would be embarrassing except for the fact he is only deceiving himself; so people laugh…. but this is dangerous.

Questioned today about inflation, Joe Biden starts talking about his Build Back Better program.  It really is worth watching to see how oddly emphatic he is in the belief that if government pays for a thing (childcare, healthcare, prescriptions) the cost of that thing somehow mysteriously disappears.

Biden believes that if government subsidizes something there is no longer a cost associated with it.  He believes this.

Setting aside the historic fact/truth that anything government pays or subsidizes ultimately costs more, the real cognitive dissonance in Biden’s worldview is that any cost associate with a ‘thing‘ disappears if the government pays for that ‘thing’.   From that bizarre viewpoint, the disappearance of public expense for that government subsidized thing then creates “deflation”, or a lowering in overall prices.

This claim is abject nonsense.  Truly and genuinely batshit crazy nonsense.

Example.  According to Joe Biden’s talking point: if government pays for college education, the price of a college student’s car drops.  It doesn’t.  To make that claim is absurd in the extreme.   The college student may have more money to pay for a car if they are not paying for tuition, but the car itself doesn’t change in price.

A person may have more money to pay for groceries if they are not paying for childcare expenses, but the price of the groceries doesn’t change.   The inflation on the prices of products at the grocery store does not change just because some families no longer have daycare expenses.   But Joe Biden believes it does.   (more…)