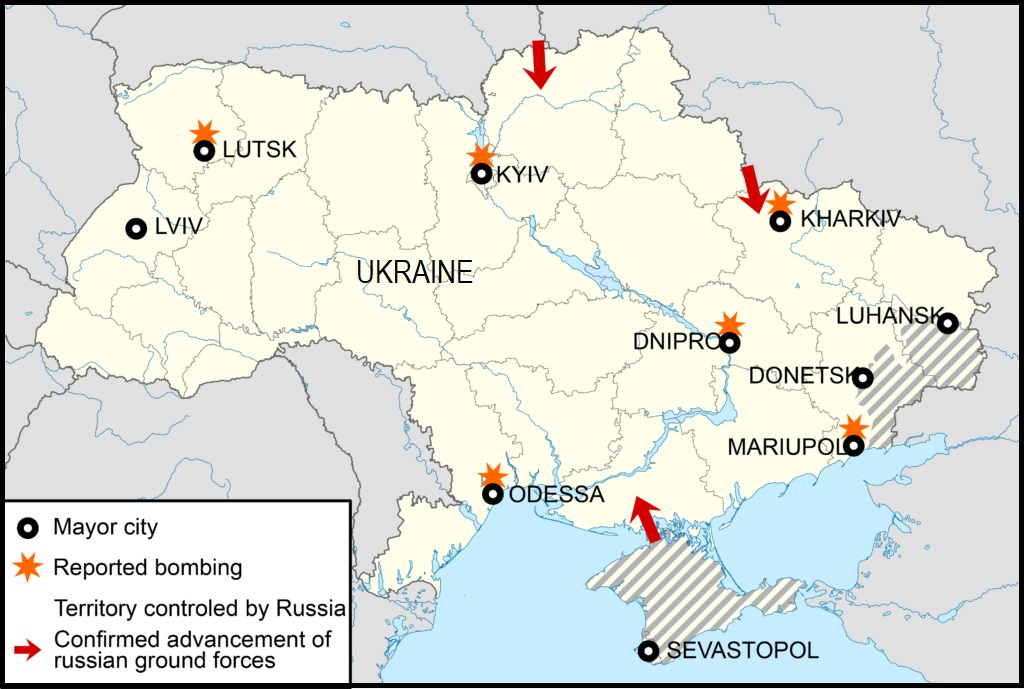
First, I did not anticipate Russia going beyond their allied region in Eastern Ukraine. I was wrong. It appears Vladimir Putin is going for the whole enchilada as reports indicate his military operations are positioned to capture all of Ukraine, specifically the western Ukraine areas under control of the U.S. State Department.
 Second, with all the prior Ukraine issues serving as a reference, it is important to remember that every media outlet in the U.S. machinery of information is untrustworthy.
U.S. intelligence manipulated information, some call misinformation and disinformation, is rampant as the U.S. has specific motives for everything that takes place in Ukraine.
In many ways Ukraine is a vassal state of U.S. leftist politics.
Ukraine has been a satellite operation for the U.S. State Department for approximately 15 to 20 years. The U.S. has held control over Ukraine, and manipulated every political outcome inside Ukraine, for well over a decade. This reality is the source of Vladimir Putin’s angst toward the west for the same amount of time, and it’s the same reason why the EU, specifically Germany, is tenuous in any collaborative response.
The EU, writ large (including NATO), are less interested in Ukraine, because they know Ukraine is the U.S. playground in Europe. This truism explains why we see a conflict when it comes to responses and sanctions from the U.S. compared to the European NATO allies.
The outcome is along the line of NATO countries telling us, Ukraine is our playground, the issues are our creation, therefore when it comes to responsive action – you do you and we will look out for ourselves, but we in the EU have to live with the reality of the outcome, so our interests will likely diverge from yours depending on what Putin intends.
(more…)
Posted in Big Government,
Big Stupid Government,
Deep State,
Economy,
energy,
European Union,
Joe Biden,
media bias,
NATO,
Notorious Liars,
Press Secretary - Biden,
Russia,
Ukraine,
Uncategorized
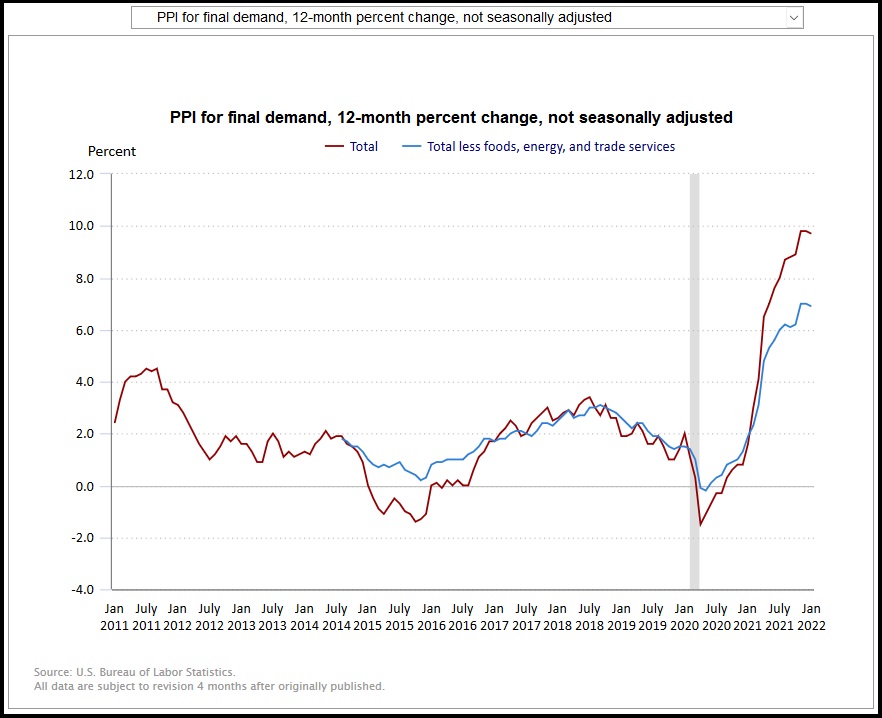
 Toward the end of last year, we warned that fertilizer costs were going to harvest costs in 2022 (
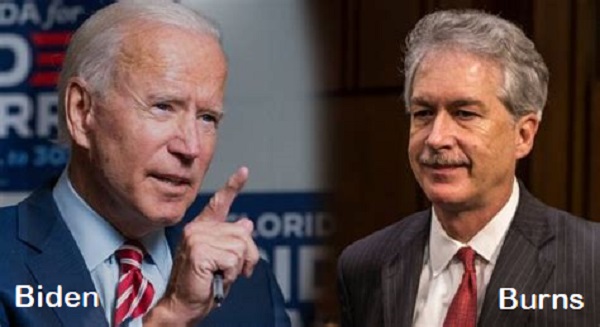 Current CIA Director William “Bill” Burns was the former ambassador to Russia and Jordan. Bill Burns had a 33-year career at the State Department under both Republican and Democratic presidents and speaks fluent Russian. If the people in the background of Joe Biden wanted an intelligence operative to trigger a specific result from Russia, there’s no one more strategically perfect for the job than CIA Director Bill Burns.
 During an ABC interview today, White House Spokesperson Jennifer Psaki gave away the game for the Biden Administration’s intent on exploiting the Russia-Ukraine crisis.
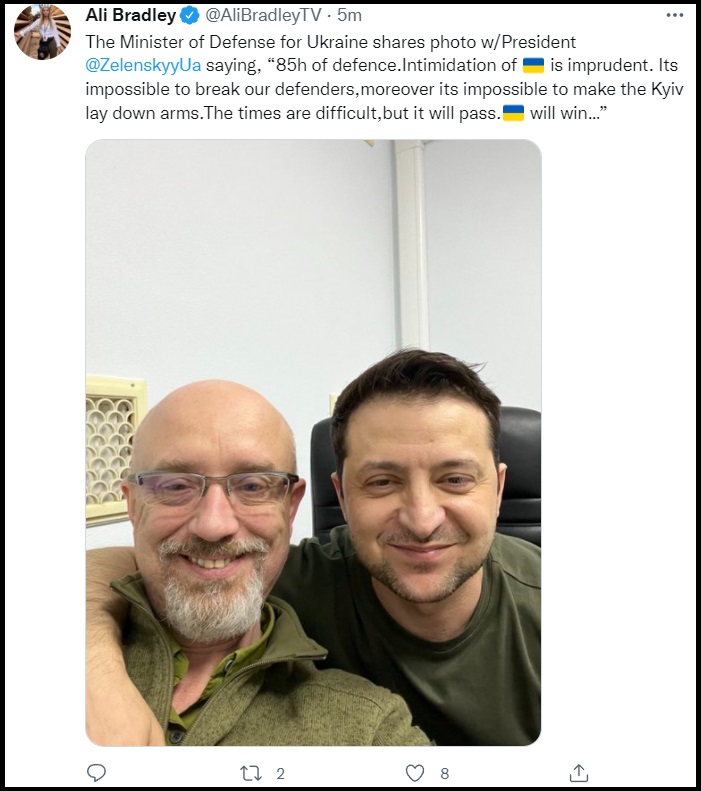 In their collective effort to make #Ukraine the modern image of The Alamo (where the last stand to defend all mankind is taking place), the corporate media, state dept and NGO’s are utilizing their
  As a result, the Biden manufactured ‘wag the dog‘ scenario, a fabricated ‘Russia invading Ukraine‘ premise by the White House, U.S. Dept of State, Pentagon and intelligence apparatus, needs to come to an end quickly.