The propaganda effort by western media, specifically but not exclusively U.S. media, to shift blame for massive economic damage from Joe Biden to Russia is reaching a stunning level of coordinated intent.
The cognitive dissonance (fancy words for telling lies under the cloud of economic analysis) is not only happening in the U.S; a similar level of blame-shifting is happening in Europe, Australia, Canada and most western media outlets.
The global economic contraction, which was specifically and intentionally created by the collective ‘Build Back Better‘ promoters, is now being blamed on Russia; and, quite frankly, the motive behind the corporate media shifting the blame is because the underlying ideology (western policy) was/is supported by the leftist media tribe.
Throughout 2021, it is well documented how government COVID policies of lockdowns, economic consequences and insane spending, created the baseline problem behind inflation. Simultaneously, the western approach toward energy development and the “opportunity” the EU and U.S. sought to exploit within the BBB agenda to radically transform energy use, was simply pouring super-volatile fuel on an already burning fire.
In 2021, gasoline prices increased 60 to 80 percent. Food prices jumped 15 to 40 percent, with some sectors even higher. By the time the EU central bankers and U.S. Federal reserve finally admitted inflation was no longer “transitory,” we were facing next harvest fertilizer prices that tripled in price from 2020, and oil prices that had doubled in the span of 12 months.
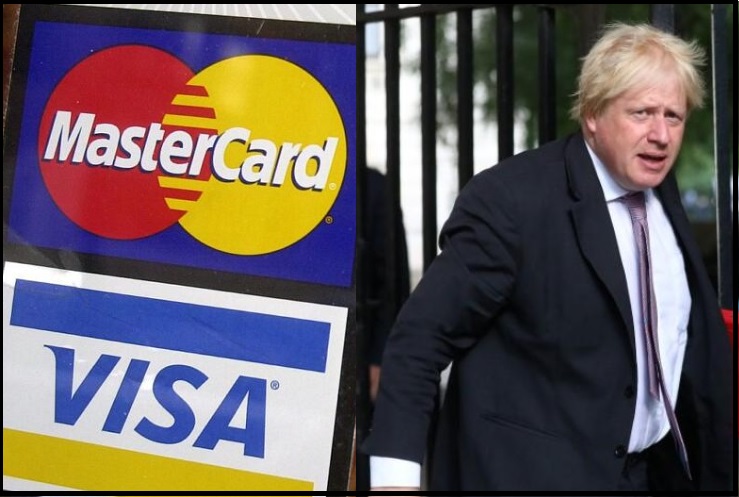 Tomorrow at 4:00pm GMT, a new British Prime Minister will be announced. In advance of the announcement, and representing the global alliance of financial interests, VISA and Mastercard released the
  When I previously said to pay attention, because we are not going to like the world on the other side of a Biden, NATO, EU, World Bank, International Monetary Fund, Word Economic Forum and multinational corporate victory, I was not joking. This public-private merge of government with private financial institutions will never be reversed… ever again.
 What we are witnessing now is not as much attached to the Ukraine crisis, as it is the continued ripple effects in that same supply chain.
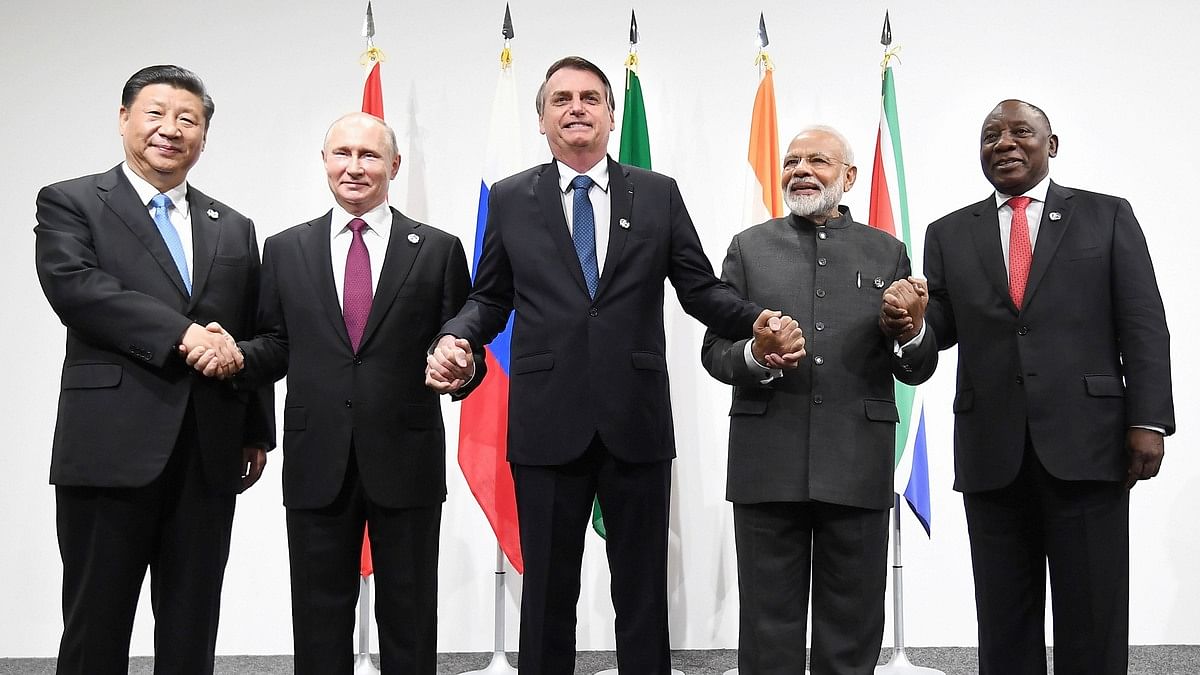
 It was only a matter of time before someone had to admit what the instructions were within the Biden administration. Today, the video surfaces showcasing Energy Secretary Jennifer Granholm making the admission.
 Additionally, methinks we are likely to get some increased economic clarity about why the White House needed Ukraine to become the big shiny thing with such urgency.