Here’s a solid example of what “field to fork” inflation is all about. Two images shared today point out how the farmland inflation originates, and how the farmland inflation surfaces in your life.
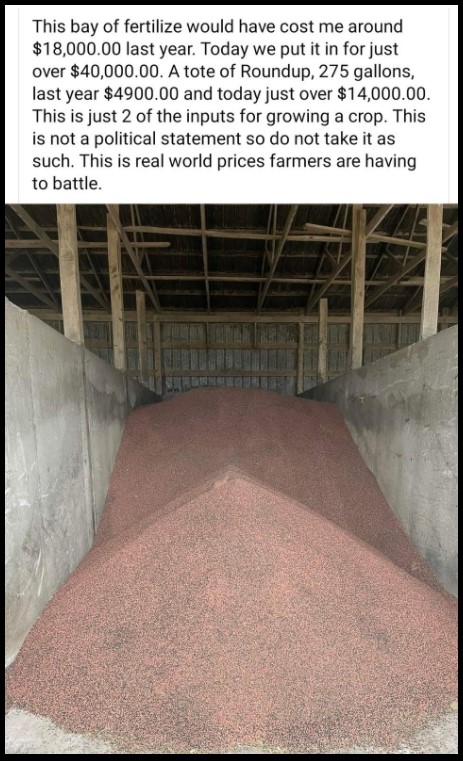 The first image (pictured right) is a current price reference point for crop fertilizer [Source] from the perspective of the farmer preparing.
To go into the deep weeds behind what is causing this massive jump in price, you can review THIS ARTICLE.
[…] “Compared to September 2020 prices, ammonia has increased over 210%, liquid nitrogen has increased over 159%, urea is up 155%, and MAP has increased 125%, while DAP is up over 100% and potash has risen above 134%.”
Those fertilizer component products are used for corn, wheat and soybeans crops.
[…] “Corn represents about 49% of the share of U.S. nutrient use, while wheat accounts for about 11% and soybeans account for 10%. Cumulatively, those three crops account for about 70% of U.S. fertilizer consumption.” {link}
Now, you might say those crops do not seem like they are that important. However, keep in mind that Corn, Wheat and Soybeans represent the baseline for not only grain production in the U.S, but they are also the primary feed products for proteins: chicken, pork and beef.
Worse yet, both grain and protein are the primary ingredients in pet foods; so pet food producers end up collecting even more price increases in their manufacturing. Have you noticed a shortage of pet food on your shopping trips?
When fertilizer goes up that high in price, the end cost of that harvest goes up in price, along with the end price of everything the harvest is used for.
So now we get to the point in the supply chain where these protein price increases show up to the average consumer.
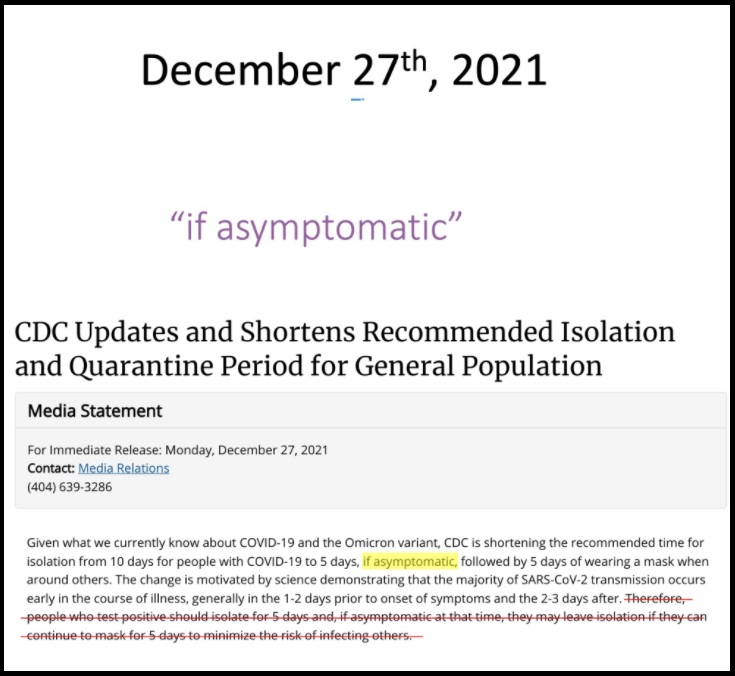
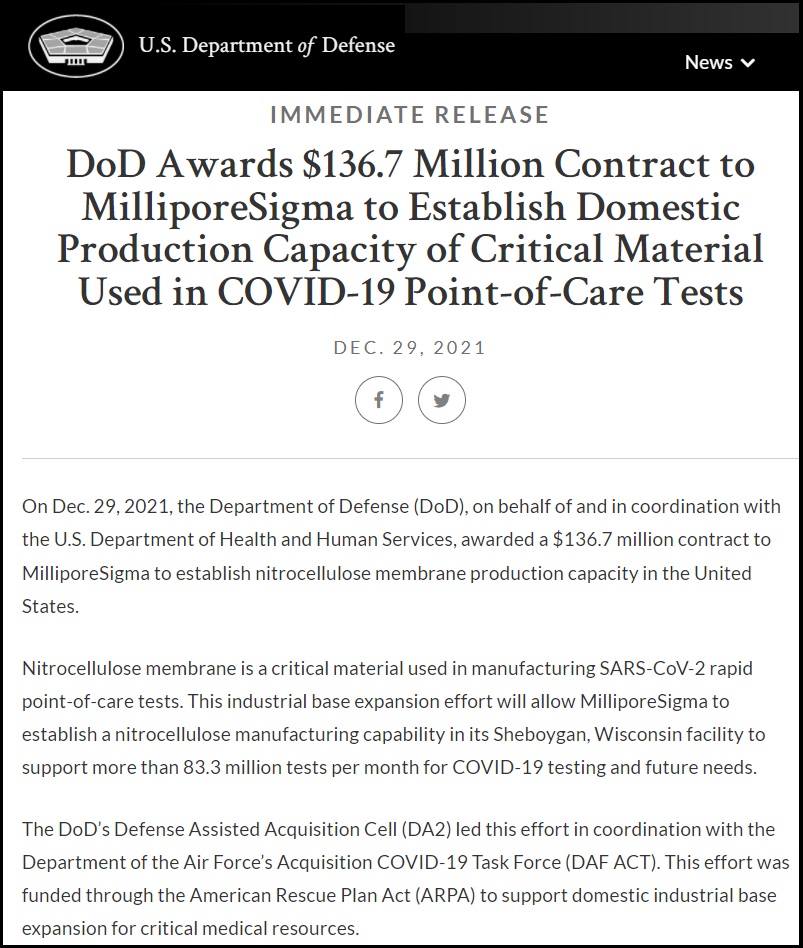 Many people feared that various government agencies, those who used the pandemic to gain raw power over U.S. citizens, would never relinquish their new authorities. This latest announcement would indicate long term plans that are likely to end no sooner than when we stop taking off our shoes at the airport TSA checkpoints.
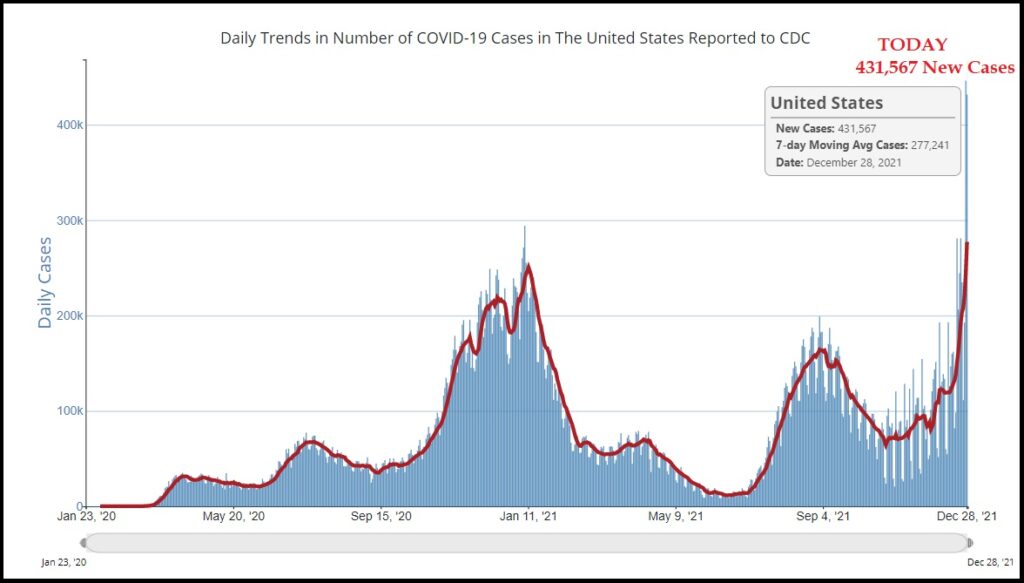

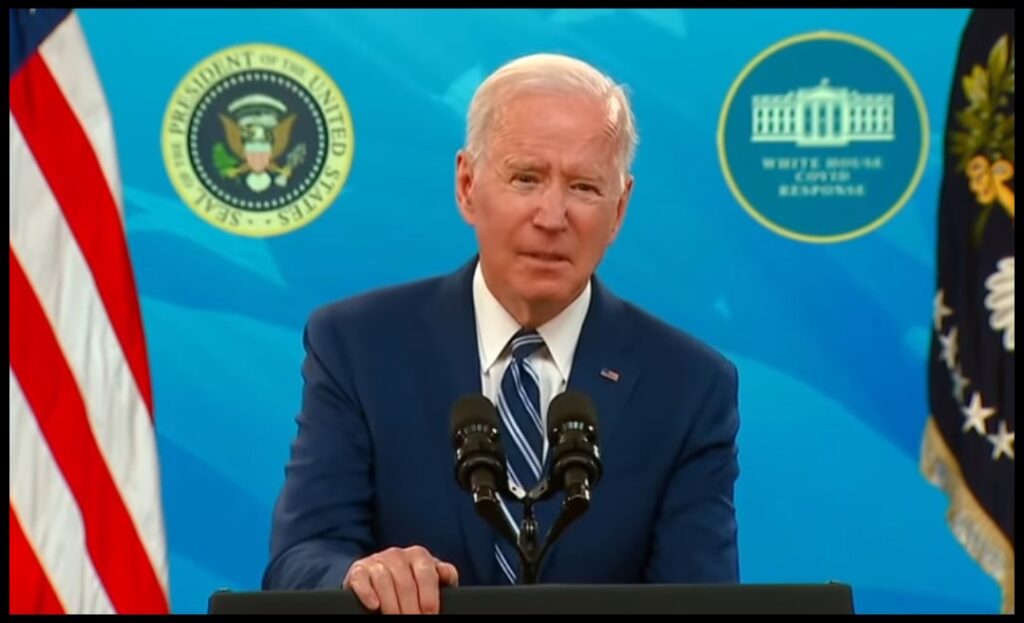 It stands to reason the people behind Joe Biden will eventually concede the issue of mandatory vaccine passports for domestic air travel to the administrative state and their donors amid the Branch Covidians. They’re in the same group circles where Anthony Fauci is venerated and appreciated.