The Bureau of Labor Statistics (BLS) has released the July inflation figures known as the Consumer Price Index (CPI) [DATA HERE]. I’m not going to spend much time on the review because the big picture results are exactly what we expected, the appearance of a false inflation plateau, drop and/or moderation of inflation.
 The July energy prices dropped significantly driven by a reduction in consumer demand for gasoline and fuel oil, which lowered prices. We can expect a very similar outcome in August (report in Sept).
Most financial and economic media are reporting an “unexpected” drop in inflation, ex:
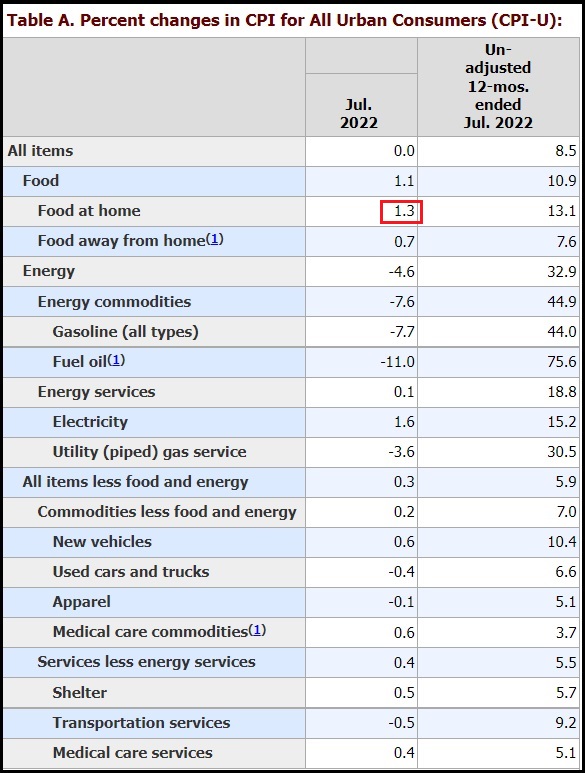
“Prices that consumers pay for a variety of goods and services rose 8.5% in July from a year ago, a slowing pace from the previous month due largely to a drop in gasoline prices. On a monthly basis, prices were flat as energy prices broadly declined 4.6% and gasoline fell 7.7%. That offset a 1.1% monthly gain in food prices and a 0.5% increase in shelter costs. {link}
Most econ people will look at the price drop sectors and accept that consumer spending on durable goods and non-essentials has become a downward price point on key categories like vehicles etc.
This is the ‘stag’ part of the ‘stagflation’ (economy), or the new lingo; the ‘dis’ part of the ‘disinflation’ (consumer spending).
For the middle-class or working class, especially those families with young children, I would shake all those data points away, clear the table and look more closely at [BLS Table-2] to see where our eyeballs should be focused.
Look closely at all food group products that originate as “ROW CROPS” and/or “GRAIN”. Just by looking at the current rate of price increase, you can easily see that all grain and row crop outcomes are going to explode in price in around 60 to 90 days.
The wholesale food supply chain is starting to price-in the future cost at market for products that have yet to be harvested. Remember, ‘row-crops’ and ‘grains’ are the most energy intensive farming and carry the highest rate of energy use in the process, including fertilizer and diesel prices. Row crops also carry the highest labor rate to harvest.
When you look at row crops and grains in the Table-2 breakdown of food prices the input price cost is easy to spot.
Annualizing the price outcomes, we see:
Flour at +60% in June and +38% in July.
Bread overall at +19% in June, and +34% in July.
Crackers at 12% in June, and +40% in July.
All grain-based categories are in this +35% to +50% annualized rate. This is a good rough estimator for what is going to happen in the third wave of food prices we have been discussing. These are energy cost increases we have to look forward to within current grain harvests. Additionally, a global shortage of grain will only make this worse.
Eggs are also in this +50% range, and Coffee around +42%.
The same is true for row crops with potato prices in July up +40% (annualized).
SUMMARY: Energy prices in July, Aug, Sept, moderate yet stay high – giving the false impression of inflation slowing as the overall economy continues shrinking. However, by the time we get to Sept, Oct, Nov, all of those high farming costs are going to transfer from the field to our forks. Food inflation in the last quarter of this year is going to be the urgent family conversation that takes the place of gas prices.
I just posted in the other thread that groceries are as expensive as going out to eat. My dogs are eating a raw portion of my dinner proteins and rice.
Not trying to be funny, but is going out to eat is as expensive as eating at home… you are doing it wrong.
Family of four, two good sized dogs, and a couple cats(the cats feed themselves). I avoid process and GMO foods as well as anything grown or produced in Canada. If it were me I could live on very little.
My 70 something Dad has been on his own for a year now after my Mom passed. He said it’s easier for him to go to restaurants that offer Senior-Veteran’s specials than to worry about shopping and cooking. It works for him and he has maintained his healthy weight. Whatever it takes, at this point.
Have him look at meals on wheels, my disabled mother in law used to have groceries delivered and cooked for her self. I called a social worker to see what she qualified for……cleaning lady 3 times a week, meals on wheels, they deliver lunch/dinner 5 days a week. Even if she wasn’t disable, she would have still qualified, they want to keep seniors at home as long as possible instead of a long term care facility.
Thanks, I’ll have him look into what he qualifies for.
My mom fed hers to the dog!!!
My Dad got MoW to make it easier on my Mom doing a special diet for him. My mom tried a bunch of them and didn’t like them. She’d try and make sure there was no waste, but sometimes the dog got them!
For your Dad, going out to eat is likely social. That’s a good thing for him.
Yes! Not only is Buckeye’s dad eating full, hot meals, he is interacting with others, and perhaps making new friends. Being with others and out of the house surely has to help him as he is continuing to adjust to the absence of his wife in his life.
Just gave my pups Arby’s roast beef. They love it!
Woof!!!!
Wouldn’t use rice constantly for your dog. Rice has arsenic in it , too much to snt a good thing . Personal recent experience.
Biden actually said today that there was zero inflation in July.
His string pullers must think we all have our food delivered by Door Dash, as they do.
Thank you…and ugh. Imbecile.
8.6% inflation in June and 8.6% inflation in July does not mean July had zero inflation … it means the rate didn’t change …
I’m wondering who wrote that speech for him. Do they not understand basic arithmetic?
oh, they understand PERFECTLY
“you can fool some of the people yada yada yada”
It feels like it’s all psychological warfare. No one is this stupid.
He can’t count too high so they gave him an easy number he could understand.
‘Mr. Biden : Zero point zero’ 🙂
50 years in the Federal legislative branch down the drain.
“Creepy, stupid, and sniffing little girls’ hair is no way to go through life, son.”
They are building the case for getting rid of him. God help us!
Didn’t Pelosi say yesterday, “no PRESIDENT or ex-president is above the law.”?
Biden rewarded himself with a family vacay w/ Hunter and a raid on President Trump, after releasing this bullshit on Americans.
Such a weak voice.
That man is so incredibly stupid that he sucks all the dumb out of a room. NASA should launch him as one of those probes that crashes into an asteroid. Might do the asteroid some damage, but it sure would improve Brandon.
Last week at Aldi another shopper was commenting on the inflated price of eggs and I said, “yeah, thanks Joe Biden.” She said “oh I don’t think so.”
I decided to just let it go and hope I planted a seed.
Forget that, those people are hopeless.
Forget that one – some are too far gone – but I’ve gotten many laughs and grins when I finish conversations with strangers about prices with “Let’s Go Brandon” – even in blueMA.
Yes! our frontier serviceman was here and I was cutting the cable cord and he blamed Russia. People eat what they are spoonfed from CNN that are watchers. Imbeciles. I don’t even respond to people who are that low IQ
I asked the kid checking my groceries who to blame the over 200% rise in eggs, to my utter dismay she said “Biden” the kid bagging said “FJB!”
Even the kids know what’s up. Encouraging.
I noticed that to. Some of them are smarter than people give them credit.
Yes but why dismay? Maybe you mean disbelief?
I see this in the young baggers sometimes too. I’ve expanded chats with quite a few of them and yes, they are more aware than we realize even in my solid blue area.
Encouraging that they are awake and sober. Many are not; many are checking out, unfortunately permanently!
They are a sad and disillusioned bunch for the most part. Knowing they are cannon fodder, inheriting impossible debt and hundreds of millions on welfare of some kind. They need spiritual help.
OMG. dpiddy and Bless Your Heart>>>> where do you people live?!
I’ve had the exact opposite experience in N. FL. Every time I’ve mentioned it- about 3 x now- everyone around me chimes in in agreement. Even people waiting in line at the cashiers!
It’s so fun to diss that A$$ publicly!
Publix was outrageous on my last visit.
I’ve planted a lot of seeds like that.
Like others, happily the response is often is yup you are right.
Probably infertile soil.
I would have had a tough time stopping myself from saying “You’re an idiot”. lol
Build Back Better.
How many users does Truth Social have now? The MSM near monopoly really hurts.
So many of the sharp, incisive people I used to read have been banned, including recently Undead FOIA. Prior to that there was Intell/Econ Chic, and many others.
BTW, my local 99 Cent Store had about 9 pallets out on the floor, atypical for them during working hours, and many shelves 60% empty. (They have the product, but not the workers.)
You might try Gab. Seems like a lot of people are showing up there, with lots of good comments.
I agree. Truth is a difficult site for me while gab is easy to navigate and build follow/followers. Some hard focused participants so check out who you follow.
Gab is great and Andrew Torba a true patriot.
I’m gonna try to “share” a Gab post. Wish me luck
https://gab.com/realdonaldtrump/posts/108798815833431265
OK. It worked, sort of.
No picture, but at least there’s a link and, unlike TS>>>>> you can read the replies/comments!!!!!
Go Gab!
If I remember correctly, Torba set up a mirror of all of President Trump’s posts to twitter and the @realdonaldtrump account just in case he decided to come to gab. Looks like he’s also mirroring truthsocial. Good to know, I would like to be able to see Trump’s truth posts without having to make an account.
YES. Ditto.
Link to Trump’s Gab account:
https://gab.com/realdonaldtrump
I have a Truth social account but most of my online friends are still on twitter. I’m waiting for when I get caught up in the next purge.
I went to a buffalo burger place this week. We had to wait 5 minutes to be seated even though there were 4 times as many empty tables as occupied tables. I asked why and he said there is a shortage of waiters.
I was near South Portland, Maine this Sunday. The kids needed a rest room. We drove into a MacDonald’s in late afternoon, with a long drive-up line. When we reached the door there was a notice informing customers that inside service was suspended. No timeframe or reason was listed.
Our Taco Bell has been doing that for over a year. hence, I moved on to the local family owned Mexican place and get much more food for a bare price difference.
I’ve seen lots of reports on this around the country – drive thru only being open. Many have signs saying it’s staffing shortages, although it could be some franchise owners looking to cut costs by not having to staff a front counter and keep the dining/restroom areas clean & stocked.
Econ Chic is on Truth Social, as well as many others.
You also might try Gettr. I enjoy it quite a bit, partly because the user interface is pretty easy to figure out, and posting my meme pictures is easy (though, as sundance has explained why, no post editing – just gotta proofread well in advance).
It won’t be long before I have 500 followers. I have no clue who practically any of them are except for three real-world friends. But every time I go on there and post something snarky I usually pick up a couple new ones immediately. Weird.
Just read an article about energy prices in Europe are going to explode this winter, forcing people to choose between going broke or staying warm. Throw in sky-rocketing food prices and it’s going to be a hell of a winter.
Energy shortages, food shortages, debt crushing the middle class. Just imagine relying on government for food, energy, money….
If I were a cynic I would say the plan is going to plan
An afterword from the Gates of Vienna translator on the situation in Germany…high food prices and bankrupting energy costs…
“Sometimes I wonder why these people cling to the belief that our governments give a fiddler’s fart for what is happening. Are they so willfully blind that they cannot see that it is the government that is deliberately destroying the economy on behalf of the globalists?
This has been going on for a long time already, and the last two and a half and years have seen that operation accelerate to warp speed. Wake up and buy rough hemp rope or piano wire to present to your duly selected, by the grace of the WEF, representative and let them dance and twitch to a new tune.”
Europe is much closer to that point than we are. Much.
I suggest we all start paying attention to what is happening there. What will be happening through the brutal cold winter in Europe as the WEF and the WHO and the UN follow through on their recently agreed pact to speed up their Agenda 2030.
Otherwise described by the psychopathic monsters themselves as the Kill Shot.
While I was in FL last winter, my region of IL experienced Zero Degrees for almost 6 weeks. Florida had a few chilly days where I was in my snow shovelling coat.
I am not looking forward to this winter.
Rah, our resident trucker on the Open Thread, posts weather related issues and forecasts, as I’m sure you know. The one he highlighted a day or so ago, shows this winter here is forecast to be extremely cold…again. Apparently above average cold.
It’s a fearful thing to think if energy prices continue to climb as planned, there are going to be many people in dire situations…to the delight of the Marxists running this country now.
I think they are reserving an EMP for the US.
Once we are out of the picture, the rest of the West will fall into the lap of the Globalists.
Good point to watch Europe.
One of the many things appalling me is the Dutch farmer situation – very glad to see them fighting back but it’s so crazy…
I’m an Optimist, but also a Realist and I say:>>> The Pan is working out to Perfection.
Live in WI. Heat by natural gas. We pay the same payment each month so our budget isn’t strained in the winter months.
Last year our payment was $137 per month. At the end, we had an aditional payment of$316.
Payment revised starting this month: $219.
Increase of $82 per month, or +59.85%.
Heat, gas up $1.64 since inauguration day, and skyrocketing food prices.
Thank you and FJB
Just be glad you aren’t in Europe. It’s 34.3 USD/MMBtu vs 8.2 USD/MMBtu in the US. Many people in Europe are looking at +8K NG heating bills this winter, that is if they aren’t turned off altogether at any price.
In March 2021 it was 6.1 in Europe and 2.6 US.
…and just like the thrust of this article, there are still more price increases in the pipeline, as the price consumers are paying today, was put into the product or negotiated (NG utilities) many months ago.
Europe is looking at serious shortages, even at these high prices. Electric heaters (yet more load on the grid that is over taxed as it is) and wood stoves are all but gone from the supply chain as well.
Live in Montana, a rather small house.
My budget pay natural gas was $33/month for years.
Last month it went up to $55/month.
Quite a large jump, percentage-wise.
Live in Montana, rather small house
My power/gas bill was almost twice the amount I paid last year during July.
M summer bills are usually half of what my winter bills are. It’s gonna be an expensive winter in this state…..
Just under a $1000 increase and I assume I will pay additional next July.
My UK family said electricity/gas will rise another 60%
You are correct!
Just yesterday avocados were up from $3.99/bag (5-6 pcs.) to $7.50. This is at Costco.
Same here in SC at Harris Teeter. The farmer’s market where I live is pretty price competitive on veggies and at least these people are a part of our community – makes it slightly less painful. Prices are still outrageous and only going to get more expensive.
Lucky you, Paul. In Santa Fe, one Haas Avocado sets me back $2.99
When I was a kid in the Canal Zone, we would pick them up off the ground…for free. Right off the tree. The size of softballs….
On general principle, I refuse to pay that…and mango’s…same deal, right off the ground and into my mouth or would share with my horse. Free.
Walmart has forever offered freshly made French Bread for $1.00. Today it went up to $1.47. That’s all I need to know about inflation and food prices.
I don’t know if you have noticed this in bread, especially the lower price entry levels. But they sure are getting more filled with air?
My tin of tobacco is now only 3/4 full when you buy it. Between shrinkflation and the price increase, it’s up well over 50%.
Maybe I should just quit.
It was the same in the USSR. Namely half filled non-transparent containers.
That is why glass was preferred by consumers. You could actually see what you were purchasing.
Dog food used to 20# bags. Now we pay a bit more for 14# bags. I’ll do the dog food now and know the food is good!
If you are on a budget and don’t have enormous pockets you change what you eat.
Avocados rarely have been cheap enough for me to buy.
Went to Publix here in Melbourne, Fl for peppers. I couldn’t believe they were marked down to $3.49 ea! I walked out and went to Thrifty and got 2 peppers for 2.99 a pound. So I got 2 for $2.50.
Over $6.50 for 18 eggs (NOT organic or free-range)!!! Obscene! In GA
FJB
In Georgia? With all those chicken farms?
5.23 for 18 eggs, here in Mooresville NC. It wasn’t that long ago I was getting them for 1.88😥
If you can, get a few laying hens.
Even with buying most of my own feed, I don’t pay anywhere near that for eggs, and mine are organic.
In St. Lucie, I don’t understand how all the young couples with kids, can afford Publix!
That is what my comment above was about the Save Alot near me isn’t the greatest and Winn Dixie has deals on some stuff but completely out of other things. Dollar General is where I get paper products.
Good times.
Gee who was the President during this sitcom?
For the 5-year run of Good Times, Presidents were Gerald Ford 74-77, Jimmy Carter 77-79.
Honest question: How is the cost of energy (oil/gas) flattening out if the US isn’t producing anymore beyond current out put? Is it b/c of selling oil reserves over seas? I understand the food side fine, but am confused with the energy side.
Temporarily reduced Demand? I see lots of restaurants with fewer patrons, and less summer vacations (i.e., less gas use).
We also foolishly sold a lot of our oil reserves.
Sold it to China, among other places.
Now we have to replenish the cheap oil that Mr. Trump bought to fill the Strategic Reserve, with the expensive oil we have now.
And Hunter has ties to one of the Chinese companies that bought our strategic oil.
I think it’s a slow of demand. We are tapped out. I know we have decreased our trips as much as possible. Combining trips, etc.
Its low demand. Just as higher transportation costs effects the price of EVERYTHING, those higher costs lower the demand for everything, as belts get tightened both by individuals, families and companies.
This then lowers the demand for transportation fuels, we are buying less at the stores, stores are ordering less as a result, so demand for diesel goes down.
Its a viscious spiral, and history says, unlike the climate change b.s., that there really IS a tipping point, when it becomes unstoppable as we go into hyper-inflation.
Yep. Vacations out the window.
Sometimes I wonder whether it was the globalarches who coined the term “staycation” to make it sound like…well, something.
And school has been out for the summer, so fewer vehicles on the roads.
Maybe we are stealing more from Syria, along with the grain we’re stealing from there.
https://t.me/azmilitary11/13752
It’s simple supply & demand. Sky high prices have driven the demand into the ditch.
When demand goes down the available supply goes up without producing more. When the available supply is up the price goes down.
Thanks, I thought I was missing something. 🙂
Less demand for fuel. Many people I know, simply couldnt afford to drive very far for a vacation and many were car pooling.
Instead of driving into town 3 or 4 times a week, now I plan better and make 1 trip. Undoubtedly many are doing likewise.
Actually I have always done that.
A mild driving phobia has served my budget well. Kind of hate getting into the car, and once I’m out doing errands, I’ve always knocked off as many as possible so I can avoid having to get back into the car again very soon.
Have never in my life driven only for pleasure.
Supply side is the same. Demand has really decreased. Here in the us maybe 7-8% reduction in demand. In China, the demand has drastically reduced, with all their lockdowns etc.
‘How is the cost of energy (oil/gas) flattening out’ – Carrie D
This year, ‘Biden’ has emptied the Strategic Petroleum Reserve down to levels last seen in 1985.
The drawdown was to stop in September. But ‘Joe’ just extended it by two more months, all the way to the election.
Statutorily, it’s illegal: an actual physical shortage is required to tap the SPR, and it doesn’t exist.
Meanwhile, if a serious emergency DOES occur, we are ill-prepared to face it with the SPR fuel gauge dropping toward ‘E.’
Next year, the SPR will have to be refilled, possibly at higher prices than it was sold for.
That’s Bidenomics in a nutshell: sell cheap, buy dear.
And pray there are no hurricanes in the Gulf this year.
The month-to-month price always tends to go down in the summer. In late spring there is a mandated EPA formula change for summer that causes a temporary shortage and higher prices. When that settles out, the price goes back down a bit.
Because the US dollar’s relative value to ‘all’ other currencies is rising because the US dollar is the world’s reserve and primary trading currency.
All the US dollar debt ‘outside’ our borders needs a continuous supply of new dollars to pay that interest.
…and when nations and individuals ‘default’ on that debt (ie Sri Lanka) the ‘total’ supply of dollars goes down internationally as well because most dollars are held as interest-bearing debt instruments, not as physical cash. Same in the US BTW.
Energy makes the world go round, so less total energy, less economic activity, less economic activity, lower ability to service the debt, both domestically and internationally.
Whatever it takes to keep the stock market juiced, heading into the midterm elections.
When Zimbabwe went through hyperinflation, its stockmarket fairly well preserved its value. You could say that its stockmarket skyrocketed when valued in Zimbabwean currency.
You ARE SOOOOOO correct.
after the midterms – if they keep the Deep State Deeeeeep, then they have no worry over investigations or budget issues – and they can slaughter PDJT and every red flagged online commenter.
That’s why I always come here to complain about rigged elections.
me too, you either are all the way in or not.
Also, keep in mind that the so-called ‘inflation reduction act’ has a provision to tax stock buybacks.
So maybe this is the last bite of the apple for insiders to cash out by giving themselves big payouts while they load up their companies in yet more debt?
If I was Obama or one of his minions tasked with the destruction of the Middle class and America, I would make eating at home more expensive then eating at fast food joints. People will then be more inclined to buy their meals at the woke multinational food corps like Starbucks and McDonald’s etc. This will reward the corps for pushing the woke agenda.. You can imagine where that road will lead.
Oh yeah. Eating fast food cooked in vegetable/seed oils that are loaded with Omega-6’s (extremely bad for human immune system health), salt, sugars, and sourced from unknown origins. I can’t think of another less-healthy diet that still attracts people.
Southern comfort food has to be close and a lot of it is made with fresh ingredients.
I have eaten a variety of southern comfort foods. IMHO if it’s made from fresh ingredients and fried or sautéed in real lard or butter then it’s a whole lot healthier than food fried or sautéed in seed oil.
I love boiled collard greens with butter ad salt & pepper, or a dash of vinegar over them. I love boiled 20 minute grits (see My Cousin Vinny for specifics) with butter, salt & pepper. And I love black-eyed peas fixed southern style…
https://www.tasteofhome.com/recipes/southern-black-eyed-peas/
But this is dangerously close to going way off-topic… 😉
Actually, it is right on topic. Much of comfort food was created using cheap ingredients at a time when food became very expensive in relation to income. It was made to taste good by fats and sugars that made the cheap proteins and barely edible veggies palatable. Fried catfish, mashed potatoes and hush puppies were ways to make something from almost nothing. That is just one example. Those greens are good because the cook threw in a bunch of salt, maybe some sugar and certainly a few pork bones. People did not learn to eat turnip greens because they were good. They made them good so they could eat them.
Grandparents in Maine always had a coffee can packed w/ Bacon Grease in the fridge.
👍 👍
And another with chicken fat.
I love all of that. However when I was a young lad my father taught me a life rule that has stuck with me ever since – “everything in moderation.”
And those folks burned so many calories a day just trying to survive being fat was the least of their worries.
You are correct about stretching food to make it go farther and fill more bellies with some protein and lots of vegetables. Practically every bone and vegetable trimming in my house goes through the stockpot before it hits the garbage or compost.
Get a few hens to feed those veggie scraps to.
Then you get eggs and can add their manure to the compost heap!
As long as you take the middle stem out of collards!! Hold whole leaf (I never use bagged chopped collards) upside down by the stalk, and tear strips of leaf off in a downward motion. The pieces will tear along the veins.
Kickin’ Collard Greens Recipe | Allrecipes
A good rule of thumb. If what you are eating is must be produced in a chemical processing plant it’s likely bad for you.
For example. I have grown a lot of sweet corn over the years, some is growing right now, and none of it tasted like oil.
By some estimates, early man lived on about 50% fat, 25% protein and 25% carbs, all-natural. And the carbs tended to have a ton of fiber, ie an apple vs apple juice.
This is a good description of how mankind and food evolved together.
Great presentation in that video!
Chicago of the 19th century was an extremely unhealthy place to live.
They dumped the waste from the slaughter houses into Lake Michigan.
All natural.
The Chicago River was diverted to carry the waste into the Mississippi.
Typhus and cholera and diptheria etc. All natural.
A little chlorine would have gone a long way.
Properly composted, the waste from slaughtered animals can be turned into valuable soil amendments.
“Do the laws of physics cease to exist in your kitchen? Perhaps these were magic grits? You sure about that 5 minutes?”
Yup! 🤣 👍
I noticed the lines at these drive-thrus have become much longer. Starbucks is on every corner. Eventually cash will not be accepted due to covid hoax concerns.
That must vary be region / local town, etc. In my local semi-rural ‘burb the drive-thru lines are about the same they’ve always been, except for 2020 when everything was shut down for several months.
OTOH, the 3 or 4 food stores that we patronize have remained fairly well-stocked and attract the usual pre-covid volume of customers despite the high inflation.
Plus some bugs in the food. Extra protein, so I hear.
And the stock market just went up 500 points?
yes- they just an (edit – did) an Inflation Reduction Act injection.
see how this works?
dot + dot = ____ stock up.
You just can not SUCCESFULLY continue to piss on Americans, and tell them its raining.
Effectively, Biden admin is causing the last hold outs, refusing to swallow that big red pill, to finally swallow it.
Something frankly a second PDJT term starting in 2021 would not have accomplished.
As this inflation literally increases “the cost of living” the income LEVEL at which the effect is noticed, at which it ‘bites’ is rising up through the “middle class” to those in “upper middle class” and beyond.
A wake up call, a slap in the face, whatever you want to call it, the sleepiest of the sheeple, and all but the most deluded and ideological of the “dem voters” are/will awaken, as a result of this economic mess they have created.
Much like the raid, gotta wonder “WHAT are they THINKING?”
The EOOR (Enemies Of Our Republic) are TIIIC (The Insane Idiots In Charge) and the architects (or cartographers) of their own demise.
Fascinating to watch, actually.
if they steal the midterms – they got 2 more years to piss on us.
they dont have the hide the steal, or be clever either. We are civil.
They will steal it and we will do nothing. Sorry to be negative I just no longer see Americans like a john wayne, now they all seem to be Barry Manilow and i like some of his music. But music ain’t gonna fix this.
we steal it in 2023.
You’re dreaming bub.
Well, they ARE still TRYING to steal the elections.
The evidence SEEMS to suggest they were transparently attempting it in Az, but ‘balked’.
Is it because they realised 125 percent turnout was simply too obvious a confirmation of the fraud the MAGA candidates campaigned on,..or;
Did they figure “let it go, we’ll knock out KL in the general!”?
Also, just as with PDJT, they seem to have made little effort on all the other MAGA candidates (except on, the MAGA chalenge against odious RINO who was spokeperson for the audit) ,…point is, did they focus their steal effort on KL, and not the others because, again they figured to cheat on them in the general?
They effectively get two bites at the apple, and the primary can be a “dry-run rehearsal” for the Steal in November.
In Az., they really have their backs to the wall, and have no choice BUT to do a steal, no matter how blatant.
The MAGA Coalition has clearly vowed they will actively pursue jailing every SOB that has participated in election fraud, from the ballot mules to former office holders and party leaders.
Given that, why WOULDN’T they steal the election, to avoid being destroyed?
November, in Az is going to be the KEY battle for the establishment elites survival.
On the other hand, its going to cost them mightily, and will only put off the inevitable.
Most governing occurs at the local and State level.
For this reason, I suspect that when a State Government loses legitimacy (in the eyes of the Governed) the effects of that loss may be far greater than the loss of legitimacy of the Federal Govt.
If they successfully steal it in Az, in November it may well be a short lived pyhric victory, with a citisens responce that goes far beyond yelling “lets go Brandon!”
“,…reaping the whirlwind” comes to mind.
i’m with you.
have everyone organized to go to every COUNTY (not DC like j6) – so when this blatant steal occurs America can go full George Washington and the LOGISSSSSTICCSSSSSSS are there to support it.
Alinsky – Organize a mob and keep it around for use when u need it.
its your TURN to do it
I went out to a local restaurant (it’s a chain but a decent one) to have lunch with my wife. We usually just split something, which we did, getting a turkey club sandwich and fries, something we’d ordered probably 10 times before over the last few years. What I liked about it was they only used two slices of bread instead of three, and really heaped the turkey on there, with plenty of bacon, lettuce, and tomato too. But they changed it now. I came on a sub roll had literally 1/8″ of turkey meat on it, one single pathetic piece of bacon, and the rest was lettuce and a single thin slice of wimpy tomato. The bread and lettuce comprised 90% of the sandwich at least. The fries were OK though. They are going to have a tough time in the next year or two me thinks.
The term I have seen for that is “shrinkflation.”
I stopped at a Cracker Barrel the other day and ordered their chicken and dumplings……….almost positive they used canned chicken……it was gross.
If I had to guess, I might suspect that they are using more thighs and legs.
I agree. It is nasty. I am sure they also changed their meatloaf recipe this last year. It’s not the same.
Maybe that’s one of the reasons they started serving alcohol – highest profit margin available after they lowered the quality of the food.
psychologically something I purchased at 2 dollars for years, when i set (edit – see) it at almost 4 dollars now it makes me not purchase and worry.
these little changes in prices have a huge impact, and I make okay money. My guess is that every person no matter how much money they make they spend at that level – and this is impacting Everyone psychologically.
I shop less, I buy less, i share less, I play less, I go out less, I realize my lifestyle has to change more. I am personally affected and cannot deny it.
Virtually all of my neighbors make over 200k (around here that could be a cop and a nurse), many families are probably over 300k or even 400k. I truly don’t know a single household that isn’t feeling the squeeze. The amazon truck is coming down my street less often. And there’s less door dashing going on. I’m telling you that people in the high income categories are feeling squeezed. And with the exception of the true Kool-aid drinkers, people at every income level are absolutely blaming the Biden administration.
Pay attention to packaging now; they’re shrinking most, if not all, items, including packages of sausages, hotdogs, etc…
I was specifically looking for a 6 oz. item, (which I never buy but wanted to try a new recipe),only packages available were 5 1/2 or 5 1/4 oz.
thats the other psychological thing that pisses me off, not only am i noticing the price but i’m seeing this deceptive move at air filling the bags, and all that shrinking stuff.
I’ve always had alot of play money. and I just dont see playing as a smart option anymore
Pay attention to the packaging itself!
Twice now I’ve had stuff fly across the room cuz the plastic package ripped on the bottom or side and the stuff went flying out.
Cardboard was also pathetic thin for a while. Had Cranberry Juice bottles go flying, just fr/ picking the dang thing up to put it away. But they figured that one out and thickened up the cardboard after a few months.
If you store and rotate food you see this all the time.
Hey, this tuna can doesn’t fit and/or is thinner than the one I bought last year?
I’m constantly adjusting my can racks for whatever the latest can size they have is.
The #10 cans though, so far, have been 100% the same, dimensionally. Perhaps they have more water in them though? I guess I’ll find out in a few years. But since restaurants buy these size cans, hopefully not.
My #10’s have remained the same by weight, for now. The prices are up considerably.
I think there are a lot of people doing the same as you describe – cutting here, there and the next place. Some things that felt “normal” a couple of years ago now feel too extravagant. So, my household is doing just what you describe – and we are not a family that is struggling, as so many are now. We worked hard to pay off debt and get ourselves as financially sound as possible. I hope that and other types of preparation will be enough to carry us through what appears to be some very hard times ahead.
But, there are still lots of folks out there going on expensive vacations, buying luxury items and paying $9/lb for chuck roast. My last Costco run I saw lots of folks with carts piled up with loads of snack foods and gadgets and such – stuff that many of us would now consider unnecessary and not purchase. We’ll see how long that holds up as we watch Sundance’s projections coming true this fall.
I know. Having shopped in the 3rd world you would be amazed how far the purchasing power of a typical Costco run would go.
Now it’s not all this fancy pre-packaged massively processed and marketed stuff for sure. But with a good set of spices and some work, it’s still good food.
I’ve been preparing for this since the Wuhan Virus lock downs here in PA. I knew that shutting business down and giving away free money wouldn’t end well.
I’ve been stocking up on anything and everything we use when ever I see it on sale. Grocery prices have skyrocketed, but so far I’m still finding bargains. Well except for milk, milk is never a bargain in PA!
I’ve always been frugal, so my lifestyle hasn’t changed because I’ve already found ways to have fun on the cheap!
Grandparents up in Maine always said nobody up there even knew there was a “Great Depression” going on when it happened.
People just continued to live as they always had>>> dirt poor.
Course, the difference is, most people back then hunted and gardened, canned, bartered, etc.
Those everyday skills are lost arts for many.
Yes, it is. And as an actual rocket scientist, it’s taken me ‘only’ 10 years to arrive at amateur status.
Though I’m trying to master about 30 different foods (seed to harvest to seed), plus I have a full-time job; but it’s still way harder than just putting a seed into a hole.
Great website below if you want to cut your learning time down.
https://www.youtube.com/c/MelissaKNorris/videos
P.S. this year I’m ‘attempting’ to start next year’s potatoes based on this year’s potatoes. Wish me luck.
My guess is you want to keep about three of the largest ones in a 2 sqft area?
A light dusting rooting hormone will help!
Don’t guess, learn what works in your area.
Go on-line and on YouTube and contact your local county extension office.
I subscribe to Backwoods Home magazine and learn a lot from them.
The MIGardener YouTube channel is another good one.
There may be experienced gardeners in your town or church who can advise you.
I did redskin (Dark Norland)potatoes in a large potato container for the first time this year.
They were mostly small but plenty tasty and I still have a few left after about a month of eating them.
However, I would like to start another batch – there’s still time here in Zone 5, I’m told – but can’t find seed potatoes. Haven’t yet been able to get any of the ones I have to grow eyes, either.
Got another container and next year will have 2 of them going alternately, and buy enough seed ones to work with…
Best thing about growing potatoes is that all the food grows below the surface – so critters don’t snack on ’em.
steph…you can grow potatoes from the potatoes you have or from potatoes you buy from the store. Make sure your potato is cut so that there are a couple eyes in each piece. Set the cut pieces aside for a couple of days so the cut flesh can dry out a little bit (helps prevent mokl once plant-
Plant the pieces in a five gallon buck and you may have time to harvest a second crop this year….
Good Luck :0)
Skills which can be learned by almost anyone who wants to.
If you can, use the time you formerly used to go out, to prepare.
Garden, if you can.
Preserve food by canning or dehydration.
Get in good physical shape.
Learn skills, like repairing things.
Most of all, get closer to God.
We can use this time of privation to prepare.
Have you noticed Spring Water dissapearing?
Yes! I was in BJs yesterday and wanted to buy two cases of it. They were out of the Deer Park brand in the regular size bottles so I ended up buying two cases of minis.
something is wrong.
your tap water is vulnerable. Testing for anything can go up by simple additions.
So everyone should have a 3rd world water filter right now.
Stop posting until you have one on the way at least.
https://www.berkeyfilters.com/
Many other brands out there, do your research.
But clean water is critical.
Try the no food, no water challenge, for three days, and then check back, it’s a horrible experience, let me tell you.
You aren’t mentally far away from jumping off a bridge.
What are you doing ‘right’ now that is this important?
I have my Berkey water filter that I purchased from mypatriotsupply. I also bought a huge supply of coffee filters at Costco – I saw a youtube video that says we should run the water through the coffee filter prior to running it through the Berkey to make the Berkey filters last longer. What I don’t have is a rain barrel to catch the water from our gutters. My husband thinks it’s a bridge too far. But since he’s been so tolerant of all my other preps, I let it go.
Get Sterlite tubs, with lids to run your rainwater into.
Cut a hole into the lid of one of them, run your downspout into it. Fill it, put on an intact lid and put another tub under the downspout.
You can store other stuff in the tubs until you need to collect rainwater.
Just some information.
Mypatrioysupply doesn’t have the Berkey brand, they have Alexapure, similar to Berkey.
Currently they have a three month food supply with a Alexapure third world water filtration system for Just under $900.00
https://mypatriotsupply.com/collections/special-emergency-food-kits/products/3-month-emergency-food-supply-plus-a-alexapure-pro-water-filtration-system
Comes with one filter, good for filtering 5k gallons of water. The unit can take up to 4 ceramic filters, good for 20k gallons of water.
Thanks for the coffee filters tip, forgot about that.
Try purified water. Local StopnShop is out for weeks at a time as is Bj’s
i know – but its crazy that the water that is hardest to contaminate and apologize for “later” is GONE , missing, not there AT ALL in walmart.
Buy a Berkey, or other water filter.
We’ve used one for two years now, I clean & purge the filters and reuse them.
From ShadowStats which shows the “old” way of figuring CPI:
“July 2022 Annual ShadowStats Alternate “Corrected” CPI Inflation eased to 16.8% from 17.3% in June, otherwise still a 75-Year high, on top of year-to-year Gasoline inflation pulling back to 44.0% in July from 59.9% in June.”
We’re running out of time to get many bargains. I noticed that LeSeuer canned peas, which would have been a spring crop, have risen to $2.69 a can in Walmart. I wasn’t buying any, but people will have to make choices that they have never had to make before on the quality of products they consider buying.
That is the only canned peas that I like. The smell is mild compared to other canned brands.
Diet Coke raised nearly $5.oo at our local Food City. It was 9.99 today it was 14.99 but “on sale” at 11.99 if you buy 2
Fortunately for us, my husband and I both quit Diet Coke a while ago. We each had a 2 liter a day habit. I quit when I went low carb about 6 years ago. My husband quit more recently when the city imposed the 1.5 cent per ounce soda tax. I switched to regular tea (which I normally drink on ice) and my husband switch to powdered diet iced tea mix. Even then (at the lower prices), we noticed a huge savings in our weekly grocery bill. Quitting wasn’t easy but it was worth it.
Quit buying soda a while back. Now it buy 2 get 1 free for 15 bucks, so sorry water is fine.
Diet Coke is poison…chemically made to addict people.
They hire the best chemists.
Try to get off of it, you’ll be healthier and save money.
When I quit, I was having dreams about having Diet Coke. I would hear the pop of the cap opening and then the fizz sound. I could actually smell the Diet Coke in my dreams. I’d pour myself a glass over ice and think, “Aaaaah. This is what I’ve been missing.” And then I’d wake up jonesing for a Diet Coke. For months, I’d have that same dream. After a while (and I mean for like two years), the only time I’d really miss Diet Coke was when I was sitting across the counter from my husband and he’d open up a big tub of Utz Sourdough pretzels and the smell of the pretzels would waft over the counter calling my name. All I’d want was a giant Diet Coke washing down that tub of Utz pretzels. Fortunately, I’m completely free of Diet Coke at this point, but I know I am a true addict and I wouldn’t dare even have a single sip of it. (“One isn’t enough, so one is too many.”)
I was a Diet Pepsi addict for years until they reformulated it several years ago, new stuff had a horrible aftertaste. Took up tea, saved a small fortune.
The past 3 years I’ve been able to get Pepsi & Coke 2 liters for $1 on sale. Now instead of being 4/$4, they are 4/$6.
I’m not a big soda drinker, but someone in my house is. So I watch the sales. I’m hoping Labor Day will have a better price.
Good place to put this bit of news. Pendleton flour mill caught on fire yesterday, still burning. Pendleton Oregon.
Vert Sad. These fires are horrible and costly and need to be investigated. Here’s hoping for no people injuries and quick recovery for Pendleton flour mill Oregon.
I think part of it is carelessness. Employees that haven’t worked there for years don’t see problems and let things get out of hand.
Yet another fire in the food production industry. The “coincidences” keep piling up.
A fire in a grain mill is one of the most dangerous industrial fires that there is. It is often safer to let it burn than to do things that will create highly explosive suspended grain dust in an enclosed atmosphere. Even hitting it with a high pressure stream of water might create an explosive atmosphere.
It was an old mill. Built of wood .
Of course it did.
you have reached the point of “no shock anymore”
your next step – you may not be comfortable with – but it is a natural progression and you have no choice.
haha. What’s the next step?
Your analysis is spot on. It worth reiterating that since oil and gas are sold on a world market and are still the overwhelming choice for energy, their price (primarily oil) represents the world demand for energy and consequently are a proxy for worldwide economic activity. As recession reaches the wider world, the oil prices will continue to drop, but prices on products will continue to rise, so it will be an assymetric inflation/stagflation as you point out.
I almost do NOT want gas to go down simply because the fraud made it about HIM doing something.
Sundance correctly points to upcoming harvest costs this Fall. Many crops in the ground now are under older contracts. Regardless of how bad food costs will be later this year, there is zero to indicate next year’s crops won’t be far worse. There is nothing my co-op neighbors can see that will make production less expensive. As such, you’re likely to see many farms scaling production back.
I would add to that, if you don’t have saved seeds, now would probably be the time to pick up your seeds for spring planting before they are gone, or the price goes skyward.
Ukraine is the top exporter of Seed oils, Seed oils, Seed oils, Seed oils. not wheat.
I am going to do that this week! Great idea!! Thank you!
Food is just going up. I was surprised the other day when I paid more for a loaf of bread than a combination lock.
But you can’t eat a lock.
I can bake, but during the summer it’s too hot. I’ve been buying the same fairly inexpensive, but not horrible whole wheat loaf from Aldi for $1.25 for a 16 piece loaf. It took a major jump to $2.10 a loaf.
Their cheaper loaf went up… but not as much. It’s one of very few items that I am still buying… but I’m making sure we use every single slice.
Get a solar oven, they work great.
https://offgridcookingwarehouse.com/product/all-american-sun-oven/?gclid=Cj0KCQjwrs2XBhDjARIsAHVymmT4k1nMOCtB54Gc6pnpSzZQfGCN386P6vfs4b3tVW7iswWMGjzv-kUaAlviEALw_wcB
Oh my this is about 4x more expensive than when I purchased it.
Still they work great, even if only about 3-4 months in the PNW. They should work nearly all year in AZ.
I’m regretting that I did not invest in a solar oven a couple of years ago. Kicking myself as I look at today’s prices.
Get both, you will need to lock the bread up!
I expect an attempt in congress to pass price controls on grain. That always seems like a good idea until one looks at the cost of inputs for production. The average 2,000-acre farm will spend over $2 million to put a crop in. These people need to at least net that just to keep on going. But, politics is politics; what the Free Stuff people in the House of Free Stuff in Washington, DC want is what they will get. Then come spring they can rail against the unfairness of it all as farmers drop like flies. Thus, a new Farm Bailout bill will be pushed, and the merry-go-round just keeps on going.
The same thing happened in the French Revolution.
Illegitimate governments always attempt to ‘control’ prices via edicts and rationing. They have ‘never’ worked, over 5,000 years of recorded human history.
Real market prices on the other hand both reduce demand ‘and’ increase supply at the same time.
But markets only work if you don’t have an illegitimate government basically focused on destroying modern civilization.
Regardless the system will always ‘eventually’ reset, only after much pain and death, unfortunately, spring will always return, but only after enough demons have been sent to Hell and enough patriots to Heaven.
The owner of Azure Standard sent out an email and said that wheat prices have doubled and the drought has severely affected the wheat harvests, which will affect next year’s wheat. If the wheat price has doubled and all the ingredients that go into making a loaf of bread have doubled too, that bread is going to get expensive. Also, not mentioned by Azure, but read elsewhere, the protein in the wheat has suffered under drought conditions, which means the bread is even less nutritious.
If you want to store up, and don’t own a grain mill to grind your own wheat, there is a brand of flour that I recommend. Wheat Montana premium all purpose flour, which is non-gmo, is available at Walmart in 160 oz bags for $9.12. I recommend buying as much as you can afford. If you keep it in a cool, dark, place, it will last a long time. If you can locate a 2lb bag of dry yeast ($5 would be a good price), it keeps in the freezer for a long time. Making bread with flour, water, yeast, and salt, is super simple, and will taste better than the bread on the shelves.
So this is a great source to stock up on all things plus really essential equipment to process less expensive food into something you can eat. You may find lower-cost sources for all this but you need to be thinking about this, now.
https://pleasanthillgrain.com/
I have a spreadsheet of all we have bought from them and others, and right now our ‘actual’ food inflation is running at over 9% per year since 2010 as compared to official ‘food’ inflation of only 2%.
Some stuff we are only now consuming in 2022 and backfilling, others I’m replacing with more expensive freeze-dried, which I hope will outlast me.
Some foods just don’t preserve well via canning and drying; so that is my focus now for freeze dried. Which reminds me, it might be a good idea to get a freeze dryer.
Anyway, why 2010?
Well because that is when I realized how corrupt everything is, at the tender age of 45. Yes some of us are slow learners.
But back to the present problem.
Many essential foodstuffs are now on backorder from the website above? Perhaps you’ll have better delivery and price results where you live.
But you all need to get on the list now.
Plus really think about clean water, heat, and food. Especially for you Men and Women with young children.
We have no future, without them.
I tell you, once I figured out how I wasn’t protecting my children (in the old paradigm), as a real man it will bring you down to your knees.
Seriously, you can’t prepare now, as a man, to do whatever you can, to protect all that you love?
In fact, that is the greatest fear of all men in war. To die, even if for a worthy cause, and yet leave those he loves to fend for themselves.
Indeed, you are correct. Our children are the future, for us as well as for them.
Food to fork in Sept, Oct and November…just in time for Thanksgiving and Christmas.
I wonder if the mid-terms will have an impact.
I’m set for Thanksgiving! I still have a couple of turkeys in my freezer. As I’ve seen things on sale I’ve picked them up. Why wait for Thanksgiving when canned cranberry sauce is on sale during the summer?
I know my prices and I doubt they will be that low ever again (it was cheaper than I bought it in 2021). Same with nuts, pumpkin, mincemeat and anything I can think of.
Hubby was making fun of me buying and dehydrating so many sliced fresh potatoes the last few months. Now that he has seen potato prices (and knowing they are going to continue to rise) he no longer pokes fun. If all else fails, I can use them to make some sort of au gratin potatoes over the holidays.
I was happy to stumble on a freshly-stocked display of 10# bags of russets at a Stater Bros market for $4.49/bag. These days, that’s a real find in my area.
Not to worry. The USDA will undoubtedly increase SNAP bennies so the welfare hordes stay calm.
The rest of us? We’ll just have to suck it up and pay for it all.
Bastards. All of them.
I think they are comfortable enough in their power position that they will let them starve along with everyone else. Mass uprisings are the goal.
Greta analysis, Sundance. Unfortunate as it is…
People will be driving more in August September as school starts up. Most private schools don’t have school buses and college students are back so more regular fuel not to mention school and travel sports. Then there’s all the public school buses needing diesel.
ROFL! Market Stupidity On Display
10 Aug 2022
Gotta love those who only read headlines…
https://market-ticker.org/akcs-www?blog=Market-Ticker
Gasoline prices were down a lot last month, but inflation was flat from month to month? That sounds worrisome to me, but what do I know.
This wasn’t meant to be in response to Winston’s comment.
Gas prices are one thing to notice, but everybody around the kitchen table will notice a massive increase in food prices. Right around Election Day, Nov. 8, too…
Snicker. The Left is toast.
#Brilliant
The left is toast … only if people are willing to vote for the RINOs that couldn’t be primaried.
Restaurants near me all did another round of price hikes over the past few weeks; the fourth since Biden took office.
Everyone I’ve asked says they’ve never seen anything like it outside the developing world.
Yes, entirely expected. I’m not buying there was a drop in demand for gasoline, but there certainly was a reduction in price which accounted for the flat cpi report.
CPI will spike again September 13. Book it.
A poor person who lives in a big city, and can’t afford to own a car. If they could afford a car, they have nowhere to park it. Gas prices are no biggie.
But they need to eat, and big city grocery stores were already expensive. Now comes the explosion in food prices that even the welfare state bureaucracy will not be able to keep up.
Another name for this person? A Democrat voter.
Skipping meals:
……”Washington, D.C. — A trend is cropping up across the country: People are skipping meals in order to fight the cost of inflation at the supermarket.”…..
https://fox11online.com/news/nation-world/millions-of-people-are-skipping-meals-to-cope-with-inflation-study-says
Bugmeat next.
No doubt -coordinated to when cicada bugs are due to resurface.
Coffee Mate large tub is up like 30% I swear. I cannot live without Coffee Mate in my coffee, unless the generic is any good.
Publix seems to have trouble stocking their brand of half and half – 1/2 gallons often difficult to get- on and off over the last year. I’m sure BlackRock’s ESG Score has nothing to do with it. /s
Economy Roaring BackMassive Aluminum Mill Idles Due to ‘Untenable’ Energy Prices
600 American Workers to Be Laid Off
“Eggs in a 50% range” – sounds like a deal.
Last visit to Sam’s Club eggs were 300% increase!
Oh no! Wow.
The real truth of inflation:
President Biden is telling everyone there was 0% inflation:
Inflation slightly came down to 8.5% in July, but from the previous months it was at 9.1% which “means” there was a “0”, zero, nada increase in inflation for July. Does Joe Biden even know what “inflation” is or means” ?
Here is the proof Joe lied again: – https://nypost.com/2022/08/10/inflation-surges-8-5-in-july-stoking-fears-of-stiff-rate-hike/ /