The “Producer Price Index” (PPI) is essentially the tracking of wholesale prices at three stages: Origination (commodity), Intermediate (processing), and then Final (to wholesale). Today, the Bureau of Labor and Statistics (BLS) released June price data [Available Here] showing another 11.3% increase year-over-year in Final Demand products at the wholesale level.
Overall, the wholesale inflation rate is being driven by energy prices. The June calculation shows exactly that problem with energy prices embedded in goods driving 10% of the price increase. However, there is some good news in the short-term for July and August, as the intermediate and raw material costs are leveling off temporarily. Unfortunately, that raw material price plateau is almost certainly the result of a drop in demand.
CTH has modified Table-A and Table-B to take out the noise.

The June inflation rate for final demand goods (2.4%) is driven mostly by higher energy prices (10%). Energy costs are passed along through every stage of the supply chain contributing to an overall wholesale price increase of 2.4% in June, 11.3% year-over-year.
Notice the slight drop in final demand services; that is important. What we are seeing is a contraction in the service economy overall, as the service sector -which includes restaurants- cannot pass along the scale of energy price increase to customers. People are changing their spending habits – service demand overall is dropping.
Additionally, the producer price index gathers data from inside the supply chain, backwards from the final stage (wholesale) into the intermediate stage (various processing) and also raw material prices. Here is where things are getting interesting, and now I can make some direct forward predictions.
I modified Table-B so you can see how the supply chain for goods is responding to both: (A) energy prices, and (B) consumer spending. You can click on the graphic to expand the image and spend some time on it if needed.
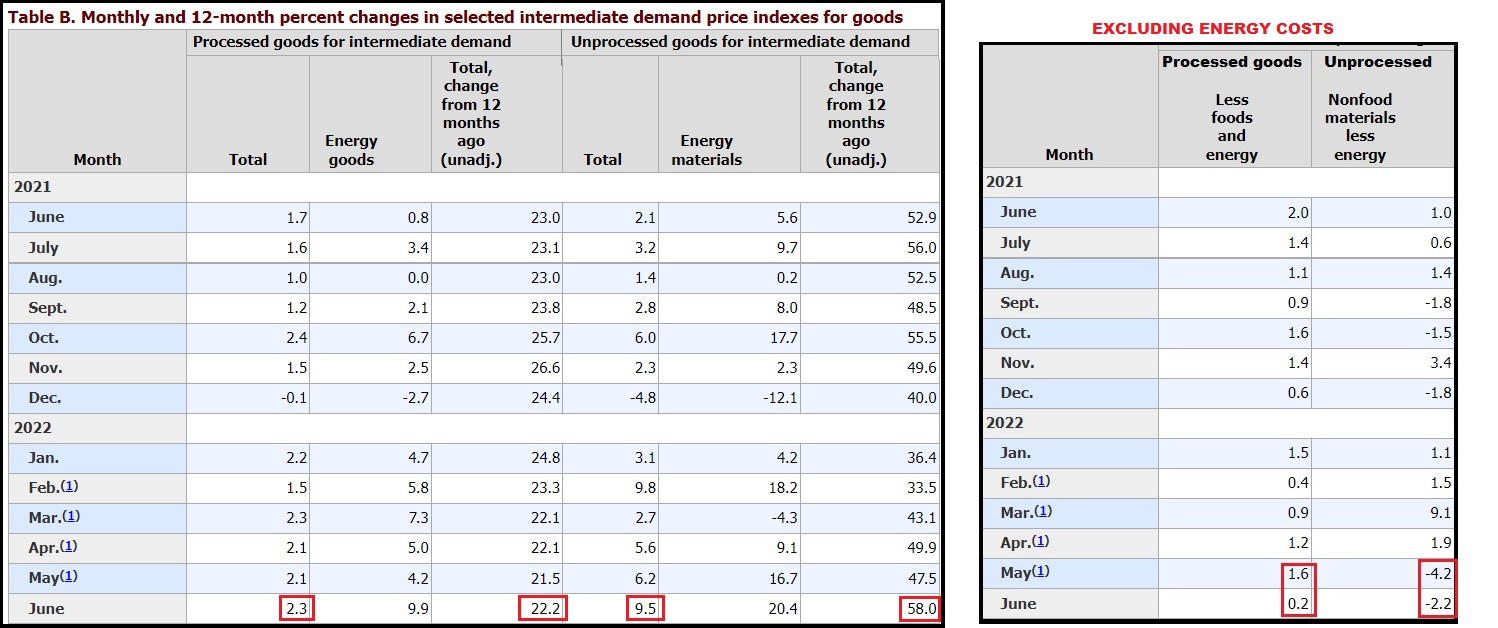
You can see from the left side of modified Table-B that both levels of intermediate goods were heavily impacted by energy prices. “Intermediate” processed goods rising 2.3% in June, 22.2% year-over-year. Intermediate unprocessed goods (raw materials) rose 9.5% in June, 58.0% year-over-year.
However, if you subtract the massive June energy costs, you will note the intermediate price of nonfood processed goods significantly dropped to 0.2% in June. And if you subtract the energy costs, you will notice the raw material prices for nonfood durable goods actually declined 2.2% in June.
Here’s what is going on…
The inflationary impact of Joe Biden’s Green New Deal energy program is running into the inability of consumers to pay for the price increases it creates. That is what is causing the demand side drops in retail economic activity on Main Street. We all know this.
As a result of these high prices, there is less internal demand within the supply chain for both goods and services. Inventories are climbing and the demand for raw materials to produce durable goods is now declining. Subtract the energy costs and nonfood prices are dropping. The decline is a raw material demand outcome.
June energy prices were extremely high. That’s driving the current PPI price outcome at all stages; but behind that issue is low manufacturing activity.
Remember, two months ago we said food prices would plateau in July and August. This PPI report shows the entry into that plateau. However, there is a problem on the horizon that is not measured in this data.
 The high energy costs to farmers (fertilizer, diesel, oil, energy, etc.), a cost already seeded (forgive the pun) is right now in the fields…. waiting…. sitting somewhat dormant and ignored by the statisticians… but that higher origination price is growing and lurking….
When the farming harvests take place, those higher field costs will enter the supply chain again and end up finding their way, via wholesalers and supermarkets, to your fork. Big Ag is going to maximize this opportunity.
Farmers will not be the ones benefitting.
♦ For the next two months the Consumer Price Index and Producer Price Index will show inflation stability and possibly even price declines.
Those reports will come out in August (for July) and September (for August) and will give the impression that inflation has moderated, and the Fed has been successful. However, in/around Sept and October the harvest cost will hit the stores. At that point, energy prices -already high- will take a backseat to the rate of inflation driven by massive increases in food prices.
Oct, Nov and December, all the way through the winter, will be painful at the grocery stores and supermarkets. Also, restaurants this fall and winter, are going to get hit hard as their suppliers start to deliver food at much higher prices. Those people in the food service industry need to prepare now for what is looming.
Everything I just described above is happening at the same time as consumer demand for durable goods and non-essential services is dropping. The current economic activity on Main Street is tepid at best. Housing values have peaked along with rents.
Every element of the U.S. economy is now entering a phase where success or failure in a Main Street business is directly connected to the customer being able to afford the product or service.
Two-thirds of our Gross Domestic Product (GDP) is driven by consumer spending. Our borders are open, our wages are flat, our prices are high, our discretionary spending is contracting. Our manufacturing and service driven economy will contract, and we are two months away from food stability, prices, affordability and potentially scarcity, being the primary focus of everyone.
FUBAR
Prepare your affairs accordingly.

Biden’s “Hold my breath until I turn blue” Sanctions are killing western economies.
I figure he has forced the postponing of my retirement by at least 2 years!
Same here. We’ve lost roughly two years of retirement income in our savings since the installed occupant took over.
<We’ve lost roughly two years of retirement income…>
The Green Raw Deal
My annual increase is now around $4,000. That is gas, food, insurance, electricity
What will the increase be when the incomes drop to zero?
I am one of the lucky few who can survive without an income. Sadly, property tax is the end game for everyone who can survive like me. I can live without everything they have to offer, but I have to pay property tax to do it. If lawlessness ensues, I can survive, because property tax will be the last thing on their minds.
True… But never underestimate the greed of local gov’ts and their sense of entitlement when it comes to their income.
Did anyone see ANY GOV’T EMPLOYEE that didn’t get their pay, benefits, etc during lockdowns, or restrictions? Even the teachers who would tech ocassionally on Zoom?
We need to have the restoration of alloidal title, where your property is YOURS. And stop gouging property tax owners for all the cost of schools. We get a crappy product for our tax dollars.
That crappy school product is called COMMUNIST INDOCTRINATION.
And ZERO is a possibility EVEN FOR SAVINGS, as they’re TRYING TO DESTROY THE VALUE OF THE U.S. DOLLAR, TOO.
I’m with you Pops 62…the same for me.
According to some studies, an average American household lost 3.4K under the most votes for a “president.” It will not get better. Don’t know your retirement income sources, but if you leave it where it is, you’ll lose a lot more than 2 years by the end of the year or early next year.
People already retired will be coming back gathering shopping carts in the Walmart shopping centers. And be fighting for those jobs.
That’s a sad but true reality. I know former corporate folks that are working in grocery store deli’s to make ends meet in their retirement.
I didn’t make it up. It is happening now.
The latest Jobs report showed the number of people with Multiple jobs is skyrocketing.
Exactly, and then there is th domino affect wherein they will get hired as they have the work-ethic to show up everyday, not call in sick or hassle the everyday job schedule. Then the low-skilled workers who normally fill those jobs will try to compete with them but won’t be able to given the baggage they bring with them – not showing up, calling in sick and then have to return to school so they will all end up out of work. Then of course there all the illegals that will get hired and paid under the table which again puts those with low-skills at risk but definitely undermines wages.
That’s why living in Mexico 🇲🇽 makes fiscal sense!
Might as well, they seem to honored by Biden as better than us.
Mexico is subsidizing it’s citizens with gasoline offsets, but it’s burning a huge hole in the national budget.
Bears watching.
YES. Biden and its accomplices honor EVERYONE better than us. Do you remember obama and its accomplices were THE SAME WAY. Consider the TREASONOUS CONNECTIONS, e.g. oscuma and biden have had VERY SIMILAR, if not the same accomplices.
If there is any life in the Christmas season this year (that is, if businessess will be hiring seasonal workers at all), those in retirement seeking to make ends meet and the usual folks looking for seasonal work/extra $ for the holidays, will be vying for the same seasonal positions…..
problem is, if you take a part time job it has to be close to home…you can’t commute across town with the cost of gas..you’ll be working for peanuts after you buy gas to get there
This year will be a blue, blue Christmas.
Reminiscent of that cold, dark winter of death the democommunists promised.
Yup. Hubby, 76, got a job to help with the budget…he is bagging groceries.
He’s a hard worker, always there, never complains, always courteous and friendly. They love him there!
I am actually seeing that now. 80 year old pumping gas. He is sooo slow. Also real old guy with the shopping carts at Walmart, as you say.
Don’t count on it.
That’s where the illegal invasion comes into play.
Senior Americans will struggle to find even the most menial of work, as is customary during leaner times.
Law abiding Citizens will see first hand how insidiously Anti American the Selected Government really is.
“insidiously Anti American the Selected Government really is.” EXACTLY RIGHT. I CALL IT TREASON.
One of my neighbors, after he retired, began to do odd jobs for people. He can do anything house related……wire a new outlet where one is needed, enclose a carport, install a door, replace windows, build shelves or a deck, paint (though he doesn’t like to paint), do sheetrock repairs, fix small appliances, install solar panels or a new water heater. I’m so glad he retired…..LOL! (It’s also good supplemental income.)
I’d like to wait out until my 401 recovers.
However, that cancer diagnosis back in March is causing me to work only until surgery and other treatments are paid for by my insurance provider.
May the Lord be with you.
That’s my story too. On my cancer diagnosis in 2018 I was told I’d have almost a year where working would be difficult. I cashed out of my business and retired as soon as I knew my health insurance was paid to the end of treatments.
I cut all my expenses, sold my home in a high tax state, moved to Florida and paid cash for my place. Very low property taxes. I have a generator, 500 gallons of propane, a garden, a compost pile, fruit trees, and a very large pantry.
My biggest expenses are insurance- house and car- and of course now food, but it’s minimal for everything else. I haven’t touched my IRAs yet, I’m living well within my means on Social Security. I’m gonna get back what I paid in and be a sponge like everyone else for the rest. Why not, I’m as entitled as all the grifters in DC.
Who is John Galt?
Florida is a GOOD CHOICE. Governor DeSantis is one of the VERY FEW politicians I actually like. Every time the Federal govt. traitors come out with more garbage, DeSantis OPPOSES IT WITH EXCELLENT ALTERNATIVES. He was Trump’s choice; I thought he would be good, and he is. My local Mayor is good, too, although some collectivist scum have gotten on his City Council, and they actually outnumber him. But he has remained very patriotic. The City Council scum and aclu scum have tried to intimidate him, but he’s held firm. He even got rid of the assanine “lockdown” crap even before DeSantis did, Statewide. (And said, “We will never ‘lockdown’ again, because he knew it was part of the scamdemic scam, aimed at doing huge worldwide damage, which it has.)
No, you are actually entitled to the benefits.
You contributed to it nonvoluntarily like the rest of us.
My recent heart attack has had me thinking more seriously about pulling back. The work I do is physical, and I am not back to 100%. I have a very good contract coming up and I will complete that even if I have to work shorter days and work more of them. After that, who knows? On the other hand, my eBay business usually picks up in hard times.
#MeToo
I had a couple of family members retire from working in the past few years. They went from living comfortably, to being almost completely impoverished (because of these Commie Democrats).
To think Piglosi’s old Rotten crepid A$$ thinks she is helping anyone is ridiculous.
Piss on that old rank woman.
You could hardly find a more appropriate toilet, although are there any demoncraps any better? How about upchuck spewmer, for example.
Yes but he knows you can afford it. That’s the missing disconnect that people don’t make.
He is brilliantly and intentionally making people pay more.
The majority of the bougie crowd is perfectly happy with this.
Just the beginning Matt as they will surely declare the need to stop all banking and freeze accounts for the National Emergency like they did in Cyprus.
I’m sure that those two years you see are just last quarters impact and not this quarter or next quarters impacts which will be more momentous.
We are only seeing what damage they have done from their prior quarters and not the up to date damages, prolonged damages, and future damages they commit as they keep purposefully destroying the countries with their global agenda of master and slave dichotomy world empire.
When they seize half of our money, like they did in Cyprus, they will meet millions of people who just wanted to be left alone.
Hopefully, the millions will make these TREASONOUS THIEVES PAY!
Well described of these TRAITORS.
He’s postponed mine indefinitely….
You have to decide…
There’s two ways to survive financially- more income or cut expenses.
You have to decide what’s important- stuff, the big house, 2 cars etc and work more hours or a second job to keep it, or downsize and enjoy life more.
I cut all of that ten years ago. Now rent hikes and gas have wrecked my savings. I have nowhere else to go.
I hope/pray you get an improved alternative. I’ve had a hard time, myself, about where to go. I sold my house for a good price, and planned to rent until RECESSION brings house prices down. But a DEADBEAT SON told his mother, where I was living, that HE HAD TO MOVE IN. So I had to move out, and haven’t been allowed to wait for the housing crash I was waiting for before buying at a recessionary price.
This might seem an odd suggestion, but have you thought about living out of a van or other vehicle?
There are several good YouTube channels, like CheapRVLiving and GloriousLifeOnWheels that profile many people who, for different reasons, decided to live in their vehicle.
Often, what seemed to be a desperate choice to survive, turned into a joyous way of life that brings them great satisfaction.
Just a thought.
We can cut expenses but we’re hanging on to our 4-bedroom mortgage -free home. I want my kids and grandkids to have a place to escape to if necessary. My older sister told me many years ago that the Lord had told her to get out of debt. I knew she was right and it took me a while but I am now debt-free. We are very fortunate to have good pensions (for now) and live simply.
I am of the age where all I want is to enjoy my children and grandchildren and do what I can to help them survive. It’s hard to see the world they will live in when I am gone. But I know this is all in God’s hands and right now I am as focused on saving their souls as I am on saving their livelihoods.
Too late for me, mine started in October. I’m already feeling the pain.
You notice no one is talking about how the seniors are getting killed on their 401’s and savings.
They didn’t care after 2008. Or any time since them.
They are also subtly stoking an age war between “greedy seniors, who took all the wealth”, and the young. Trust me, it’s coming.
“age war”: They want war between ALL; their fondest dream is make the United States into the Divided States, as in “divide and conquer”. And CONQUER is the goal of these traitors, as they INTENTIONALLY keep on damaging America.
Thief/traitors have already been killing savings. Now they’re killing stock investment that their zero interest rates forced many into to try to get a return on money. Next, I expect they’ll ruin the value of the USDollar, EVEN MORE than they have already.
Lost my ass! After working, raising children, paying taxes and being a law abiding citizen. This bastard along with his masters have STOLEN our money! Let’s call it as it is.
I’m going to retire on social security. With FJB’s inflation and social security’s COLA, I should be able to have a huge annual income. My IRA can’t keep pace with Social Security’s COLAs.
By the time I get ready to retire, individual retirement accounts will be moved over to government control and merged into social security.
Remember Obamas “MyRa”, 2010? Take from the greedy seniors to provide a 401K for a lazyass? I’m trying to figure out how to get my money out of the US, and where its safe.
YES. oscuma was/is a CONTINUALLY DISGUSTING THIEF/TRAITOR. Hard to know where ANYTHING is safe from these THIEF/TRAITORS.
The thing SO IRKSOME about it is that it has been INTENTIONAL TREASON AGAINST AMERICA, including the economy and everything else. POWER-ABUSING TRAITORS are the WORST OF ALL TRAITORS, AND THE MOST DAMAGING! And there’s SUCH A PERVERSION NOW, that they are not stopped, and NOT PROSECUTED FOR THEIR HUGE TREASONS.
So far. . .
The goal is to end everyone’s retirements and I’m pretty sure he’ll succeed. Just say it, Bye! Done! to retirement. I’m 61 and have concluded that the only retirement I’ll see is when I take my final dirt nap. Life in these United States won’t be a continuation of the last 50 years folks. In fact this world is about to flip on its head. Good luck to you all, and here’s hoping I see a few of you on the other side of it all.
“Daughter Delivers Elderly Mother with Cancer to Prison on Jan 6 Charges, “Scared to Death. I’m Frightened” By Pamela Geller – on July 14, 2022 – I was in DC in 2017 for Trump’s inauguration and the Democrats burned the city. The streets were a war-zone. Innocents were randomly attacked in the street. No one was arrested. . . . Fast forward to the summer of ’20, mass Democrat riots, looting, city burnings – no prosecutions., But speak against a stolen election and you are a political prisoner, your life destroyed.” – Read more here: https://gellerreport.com/2022/07/daughter-delivers-elderly-mother-with-cancer-to-prison-on-jan-6-charges-scared-to-death-im-frightened.html/
So the cost to make the stuff we buy is going up faster (11%) than the rate of increase for what we’ve been paying to buy that stuff (9%)…
That obviously cannot continue and have businesses remain solvent. Sooo…consumer prices must headed upward even more….soon.
Yet, weekly wages are dropping faster than hourly wages…why? Because the employers cannot afford the higher wages and the higher cost of products and remain solvent. So… hours are cut…40 hrs becomes 35 or less…..
Not a formula for economic stability…. Not MAGA. Not anything that would happen under President Trump.
Bongino has a good discussion about that on today’s Rumble.
Yes he did a very good job..
Well said GB Bari.
And if I recall, if weekly hours over certain period of time is less than 36 hrs worked, businesses can drop (must drop?) benefits (health insurance, etc.)
Those rules vary, I think, among states. But yes – it’s another significant incentive to drop hours or headcount.
Wouldn’t you know we would FINALLY have a tolerable, sensible, patriotic president (Trump), and RIGHT AWAY, back come the DISGUSTING DAMN TRAITORS, stealing govt., AGAIN.
They never went away.
They obstructed President Trump and blocked his MAGA initiatives at every opportunity. It’s miraculous he was able to accomplish anything.
They are terrified of his winning in 2024. That’s why they’re trying to fabricate cases against him to prevent him from being able to run.
Everything they’re doing now is done to hurt him. If it helps him, they don’t do it.
what you have just described is a recession.
but considering that it is a global recession, clearly, we should be classifying it as a depression, or soon to become a depression.
collapse (total) of entire segments of vital national security industries, services, food security, energy, policing.
what happens when a recession enters a depression?
war.
there has never been any other outcome.
Recession, yes. Actually several of the pro-MAGA pundits have recently started calling the current and impending worsening of conditions – the Great Recession, supplanting the previous Great Recession of 2008- 2014 as the worst since the Great Depression of the 1930s.
In the depth of the 1930s Depression, 1 out of 4 able and willing men were out of work. Women too in some smaller numbers were unable;e to find employment. I don’t think we are there yet, despite current official unemployment numbers not being anywhere near accurate. However we may be close since we have no proper accounting of the quantity of illegal aliens who are in the country.
President Trump proved that energy independence is the driving force behind a robust economy. All efforts need to be focused on domestically developing our rich oil and gas resources!
But won’t be…
I just can’t tell you how angry I am at Donald Putin for putting us in this place.
The dastardly duo.
In spite of Bidets huge inflation and his self induced recession, it’s said that 92% of democrats would still vote for him in 2024. Does this mean they are brainwashed, delusional, misinformed or all in on a plot to destroy the Republic?
He actually said it “92% Jack” to a question about his unpopularity.
I’m sure Dominion has his back.
Or pollsters lie….nah couldn’t be /s
They made it CLEARER THAN EVER what LIARS THEY ARE when they kept blathering low numbers on Trump. Fox is usually not as rotten as the rest of lamestream media. BUT they showed me they’re ALSO UNTRUSTWORTHY when they “called” Arizona WAY TOO EARLY for bidet.
I think the 94% number he quoted was in response to a poll question that asked only Democrats, if the 2024 race was Biden vs Trump again, which would they vote for? Well, duh.
Does that 94% mean 82 million BALLOTS (not votes) will again be found/pulled out from car trunks and tables in the dead of the night/counted for “the Big Guy,” or can we expect that 94% to translate into more than 82 million BALLOTS in 2024??? 😉
Definitely with Dominion Voting Machines, Math is made easy for the figure challenged (Unfortunately. most of the WOKE populace)🤔🤔🤔
They don’t like math, especially things with charts and graphs. They wait for CNN to tell them it’s bad now but it will be fixed with the Feds, or the government programs or the bull market that always comes after a bear market or the Democrats getting more Senate seats or whatever…
In other words it’s too hard to think about all that stuff and “it” can never happen in America.
You name SOME of the ways that demoncraps can KEEP ON STEALING ELECTIONS. I HOPE Sheriff Mack is right that Sheriffs will PREVENT MORE ELECTION STEALING. I think GOOD LAW ENFORCEMENT is the right answer to stopping voter fraud. {What good does law, campaigning, etc. do, when the CRIMINALS CAN SIMPLY CONTINUE STEALING ELECTIONS?}
The Democrat commies are robbing the treasury (us taxpayers) blind everyday it seems.
Which is EXACTLY WHY the “climate change” SCAM, with the goal of PREVENTING THE OIL AND GAS DEVELOPMENT! WHY? That scam comes from POWER-ABUSING TRAITORS, both domestic and international TRAITORS.
Not all of the farm production costs can be calculated just yet. The costs related to potash, nitrogen etc plus diesel and finally raw seed costs are in the ground at this point. Harvesting costs, especially diesel are yet to come. Farm production costs might be as high as +40 to +50% for some fields. Those are the costs on the horizon.
Big problem: farmers have little choice in choosing the price they can get for the crop. The choices they have are trying to wait to sell are it possibly goes up or selling on contract at a known price. These are still prices dictated to the farmer and are only choices on timing, not price.
Correct, all depends on the contract not cost to produce.
unitl they SAY F’it and start trading services locally, and the hungry people dare the gov to interfere. a global contract is worth NOTHING during a revolution.
I think farm costs/inputs are up many multiples of what you said. More like 100-200%.
That’s assuming the additives in diesel are available in a few months that make it useable in modern engines or that diesel oil for the engines will be available (literally weeks of product left) or that the special polymers used in containers for holding and transporting DEF will be available. And if they are, they will likely be astronomical in price when there’s any availability. This PPI isn’t close to hot compared to where we may find ourselves in a few short months (especially food and fuel) as more harvesting is scheduled to commence over the next few months.
Signed,
A guy who farms and ranches
Local Napa has been out of Rotella and most other name brands for the last month. Been buying up any we can find in smaller quantities at Autozone, O’Reilly even Walmart had a little. We have enough for this Fall but something better change, there will not be enough for the Winter
I think we will see a lot of unharvested fields around the nation: crops will rot in the fields because there is no fuel for the farmers to harvest them. How will history record that a nation and people so advanced starved while food was available in the fields??? I can only imagine…..
Find a local farm, it will be a pick your own scenario. Get a hand crank mill while still available. Its a good work out, and if you eat bread and nuts they work great for grinding flour
Its going to be bad. I think come September there will be shortages and price rises like we have never seen before. We have droughts, insects eating the crops, and weeds overtaking the crops. Without the herbicide/pesticide, we can forget next year for farming.
All part of the green new communist deal IMO.
Dutch farmers at risk of losing their farms to the “Department of Nature and Nitrogen”.
They want that farm land for housing. What a sick joke.
https://www.theepochtimes.com/dutch-dairy-farmer-faces-having-to-cull-95-percent-of-his-cows_4596335.html?utm_source=News&utm_campaign=breaking-2022-07-14-2&utm_medium=email&est=NkURcERVizTxUk0SkYocIU3uc3DiszleBPelaO9zPk
No doubt like the hideous, soul-less 5000 person cement blocks outside Moscow and St. Petersburg. We saw them in the 90s when we were there and it was striking. A dozen family members (or maybe more) living in an 800 sf cubicle, the tour guide said. Hell no, I won’t live there, or eat the bugs or buy anything else the WEF is selling.
“I won’t live (there) is exactly their goal; they want you DEAD.
Absolutely-and if they are successful in seizing total power and control then death is preferable. But there are SOOOO many more of us, than them-
Our domestic economic concerns will soon be accelerated as Russia-China further their own digital currency based on a basket of commodities.
Dollar as reserve currency is weakening and it’s fall is not linear.
Prepare for real dollar devaluation as these foreign dollars come home.
The ultimate carbon free economy will exist when all economic activity ceases.
You will own nothing because there is nothing.
The best part is “you will like it “.
Because you will not dare say otherwise.
Farmers selling cattle big time rather than spend money on feed. As Ice Age Farmer says , this inventory will not simply be planted and renewed next year.
YOU are the carbon to be ” Reduced “.
I drove by a local cattle market today that has a weekly sale on Thursday. Cattle trailers were lined up around the parking lot and out into the road waiting to unload.
I saw a video a couple of days ago of Texas farmers and the line must have been two miles long. Ditching cattle they can no longer afford to feed.
they should reach out to their town and neighbor towns – and have the people chip in money for DIRECT FEED to them.
If there is a coming glut of beef at the super market soon, it will be the time to buy and can up as much as possible, and also to buy pet food to store away, if you have dogs or cats.
Next year, and for likely years after, beef and other meats will be expensive, if you can even find them.
SparrowHawk, where is Ice Age Farmer, he went dark about mid May. Seen anything from him lately? Always good info there.
Same here, not seen him since May, but he may be busy growing food!
Does anyone here think we have reached peak oil/diesel? I keep trying to get my head around the sudden, and rapid idiotic decisions being made by governments all over the world. What do they know that we don’t?
The energy crisis is destroying everything, so is there a REAL energy crisis? Shell’s oil reserves have dropped below 8% and many are saying the cost to drill down so deep is 50% of the final energy extracted.
There is no such thing as peak oil. It’s the ultimate renewable energy source.
And America is awash in it.
I don’t disagree, I am just trying to get my head around what is going on, and especially what happened in Sri Lanka. They were all set to start drilling in 2019 for oil production in 2023. That would have given them great self sufficiency, and fertilizer from by-products. Who/What made them stop and go all organic?
https://www.reuters.com/article/sri-lanka-oil/corrected-sri-lanka-to-start-oil-production-in-2023-total-equinor-to-study-potential-idUSL3N25N2H3
Do research on ESG and you will find a lot of answers to your questions. Eventually China will build it for them and own it.
What made them stop was their government. They were paid off with financial incentives (both national and personal (bribes) to either play along with The Green New Deal or face international sanctions and withdrawal of support.
In short.
Sri Lankas government borrowed money in exchange for implementing insane genocidal policies set by the “lenders”.
The “crisis” is a 100% artificially engineered.
As the true current US President, Legitimate 45, so competently demonstrated earlier, by making the US energy independent. That is, before the WEF marionette maliciously undid a superbly well functioning US energy policy, by reversing it via a slew of Executive Orders.
No, we haven’t come close to reaching peak oil.
Hey, Joey? Can you come out here please and explain this stuff?
Oh, what? You’re in Israel and Saudi Arabia? Doing what?
” why I am druzzle fortstanding miscallents. If you were with me you would know that. Cmon. It’s clear.”
Maybe we’ll get lucky & he’ll stay there
Israel is a friend. Not nice to do that to friends.
But he has to fly to Saudi Arabia. Maybe he’ll go to the bathroom and open the wrong door mid-flight.
We can dream.
hope he brings up khashogi.
brashly in front of cameras.
THE “kingdom” might have to see that his return flight is eventful.
I will not shed a tear
This is the first year in my life that I’m going to go hunting. Luckily I’ve got a friend that can show me how. It sucks, but ironically the government is going to force people to learn how to take care of themselves…which in turn makes people ask themselves why we need the government in the first place. It’s going to be an interesting winter.
Watch out. Going hunting can quickly get more expensive than buying expensive meat at the store. It is in the same vein as trying to justify fishing to eat when your mode of fishing involves a $25,000 boat and $7 a gallon fuel to push it around.
Be smart and you will do fine.
Raise rabbits or chickens/eggs. Good protein.
Watch out raising chickens for eggs. Figure out exactly how much those eggs are costing you. On the Big Island Hawaii Craig’slist sellers are”giving them away” at 5 dollars a dozen.
We are past worrying about price.
We are fully in the territory of probable unavailability.
Knowing you can produce food is priceless.
There are cheaper ways to feed chickens than only feeding them store-bought feed.
Lots of info on YouTube on feeding chickens cheaply.
“Give a man a fish and you feed him for a day”
“Teach a man to fish and he’ll go out and buy a $25,000 bass boat with fish-finder echo sounder”
That’s exactly why I built my own pond. Took me 4 years but now I have all kinds of fish and no boat needed.
Well done!
Learning a skill like hunting is priceless.
Most of America that has roots and relatives in farming have no need to learn how to take care of themselves. I have been a forager my whole life, hunted occasionally, but don’t look at it as a way to survive. It is more of a healthy way of clearing your mind or doing some deep thinking while observing, conserving, and respecting the outdoors.
Go out there with an open mind and you’ll see things 95% of humanity never does. From moss with little flowers to giant trees exploded by lightning, it is a world I am frankly selfish about. I very much enjoy the deep woods well away from any trails and when I run across another “woodsman” there is an instant connection and sharing of tips and a quiet “on about our business” attitude. You’ll never get that comaradery in a city.
You are more likely to lose your life in one of our cities now.
Also, war correspondent Michael Yon has been pointing out for a while that totalitarian countries don’t have endangered species. There aren’t any of the species left. Because once everyone starts hunting, there suddenly aren’t animals around to hunt.
We don’t need them, they are leeching off of us productive people.
“Big Ag is going to maximize this opportunity. Farmers will not be the ones benefitting”.
These comments really stand out to me. When we (Patriotic Constitutional Americans)get this ship righted again, many of these problems we have currently can be fixed by the re-emergence of the most capitalist part of Americana.
Independent small business. Major, huge, entitled, businesses are nothing more than an extension of big government.
Yes, but I think it’s going to be more like trying to right an airplane that’s been pointed at the ground – the first problem is to remove the terrorist who set the controls that way, the next problem is to work against time and gravity to try to keep from flying into the ground. And in the process, a whole lot of passengers are going to get bounced all over the place, so even a success could result in a lot of death.
We do need to be positive (I think it can be done, and I think people are rising up now) but we need to steel ourselves to endure whatever has to be endured.
Agreed
Businesses have already started calling everyone back to the office. Some employees have decided to quit rather than pay gas prices to get somewhere you can’t freely surf the net, watch TV, or play with the dog for half the day.
It’s an easy way for companies to trim the fat without actually laying people off.
Depending on how far your commute is, your salary, your household tax rate, it might make financial sense to quit given gas prices, etc. Then there’s the wear and tear on your body commuting long distances and let’s be frank wasting what precious time you have on earth in a car or train 2 to 5 hours a day for no good reason.
I’ve been a TW for 20 years, and I’d have to be starving before I agreed to the daily commute and dealing with office politics all day long.
It’s not even harvesting season but like any good businessmen farmers are making plans for next year.
What they will be facing is little or no fertilizer, shy high interest rates for loans to buy seed and aforementioned fertilizer.
Bankers reluctant to loan money because without fertilizer next years crops very well could not produce enough to pay for loans.
FUBAR squared.
Correct. This year is the preseason. Next year we play for real.
Agreed! Next year we enter dangerous territory. All should remember. The enemy of your enemy, is your enemy.
Yes, but I like your user name, and it’s a good attitude for what we’re facing.
You speak the truth, General McAuliffe.
Yes, prepping the market for Gates to go on a buying spree, at discounted prices, just like crashing the housing market, preps it for Blackrock.
We SEE what they are doing, how they are using the dogs and men on horses, to herd us in and down the chute, that leads to that building that smells of Death.
We bleat and moan, and try to find a way out, but in the end,…?
Repeat the line; prepare your affairs accordingly.
Meanwhile, in the Imperial Capital foie gras is very popular.
Ammo manufacturers are warning my buddy who has a stake in a local gun store that supplies will be near non existent come hunting season.
It was pretty ugly LAST hunting season.
I thought that Dems were looking for another Covid outbreak to facilitate more ballot stuffing. Now I’m thinking it’s because they need to create a false connection between what you are presenting here and a Covid outbreak. Putin did it, Trump did it, and now Covid did it will combine in a media blitz just before the election in an attempt to blame anybody other than the Dems and Biden.
The fake polling is already being pushed out for the ballot stuffing.
How much inflation is from the 2 trillion dollars Cares act….this isn’t million or billions. 2 trillions!
The Democrats are robbing us blind, why do you think Newsome went to WH? It’s so they can scheme and launder more cash to Californians to buy votes again. California was the biggest recipient of money both via covid and unemployment scams on the American Taxpayers.
“Also, restaurants this fall and winter, are going to get hit hard as their suppliers start to deliver food at much higher prices. Those people in the food service industry need to prepare now for what is looming.”
Some won’t make it to this time next year.
I ate out two weeks ago at a favorite place when traveling. A small ‘mom and pop’ type eatery. When I paid my bill the manager had closed the dining room already, it was only 7 pm. He muttered how he cannot get help and those he does have are loyal while working 12-hour days, six days a week.
I passed back through last week, the place was closed down. Already empty.
Off topic sorry…….Ivana Trump died.
Since you haven’t been able to read Sundance’s oft-referenced guidelines for comments.…here is one of his paragraphs:
“2.) STAY ON TOPIC – please do not post something unrelated to the specific matter and content of the thread subject. There is a ALWAYS a daily open thread available for any subject you feel should get attention. Never place unrelated, “O/T”, or “Off Topic” comments on a thread unrelated to the topic. It is not ok to say: “sorry, O/T but”… or any iteration therein, it is actually quite rude.”
https://theconservativetreehouse.com/guidelines-for-comments/
duly noted
Not buying that farmers aren’t benefiting. Wheat is like gold right now. Energy costs are higher, but the price per bushel is much higher.
If I understand correctly, the wheat was already sold, at an agreed upon price, when it was planted.
Thats why Sundance says “Big Ag” (THOSE are the ones buying the grain, before its harvested) will do well, even as farmers are plowed under.
So Big Ag will benefit, NOT the Farmer.
While we power dive into a DEPRESSION, Credit Crisis: Zelensky Government Demands Another $9 Billion a Month ‘to Survive,’ Almost Doubling Previous Request
NUTS! He can auction all the arms we’ve given him. Our woke military won’t be needing them.
Imagine the dirt he must have on FJB and FBHO and the rest of the corrupt congress-scum to be barking out such outrageous demands?!
I work at a casino and there may be other factors in play but I’ve yet to see a drop off in costumers. In fact we are busier then ever. A casino is 100% part of the service sector and I’m just not seeing it at all.
My restaurants have lines day in and day out so your guess is as good as mine.
More people go to casino’s when a slowdown first hits, because they are desperate and cash is harder to earn. Their belief is that possibly winning money may be easier, than say earning nothing in a slow economy. Eventually a slowdown will come at the casino’s too. It usually lags a bit.
Yes. Atlantic City in the 80s.
Thank you for this. Your logic makes sense.
Good report, interesting. I wonder if the ‘ escapism ‘ it provides is a factor.
Yes, I believe your assessment is accurate. My wife and I often visit the casinos in Nevada. One of the things we have noticed is since the lifting of the Covid restrictions the casino business has picked up substantially. I just wonder if it’s pent up demand to get out and enjoy business as usual?
We find that it’s often an inexpensive way to enjoy some down time. Great food, nice accommodations, lots to see and do. Just stay away from the gambling! I see many people gaming and I wonder how many of them can really afford it? Casinos have historically always done fairly well during hard times…..
That’s called “gambling addiction.” They’ll go there come hell or high water.
I don’t know if tourism has been hit yet. Disney is still crowded and so are the beaches from reports I’m hearing from the newly returned.
It could be that people are vacationing closer to home and so going to a casino is a cheaper vacation than seeing the country in an RV.
“FUBAR Prepare your affairs accordingly.” Sundance
Let a word to the wise be sufficient. According to a report, today, from J P Morgan, they are sitting on a ton of cash. They believe we are in for a huge economic downturn and want to be ready, on the back side, to buy. How long that takes is anyone’s guess. Timing, as usual, is everything.
On the other hand, BofA expects any economic downturn from this point to be mild. They reason that the market has already dropped 20+ percent. (True) The average recession historically has been in the -25% region. They therefore believe the worse is over and we are very near the bottom with little down side risk.
As an older person, and a long time investor, I have to pay attention to the J P Morgan, and Jaime Dimon argument.
Any recession lasting a few years or more is not something I want to endure. I figure, for me and others like me, the risk to reward ratio has been turned on it’s ear. If it turns out I’m wrong, I miss out on any gains and end up paying some extra taxes. At this point that scenario looks like cheap insurance to me.
We’ll see…..
Right… and in May 2021 BoFA said that inflation will be “transitory”. I’m still waiting for that to kick in.
That “transitory” declaration from the Biden administration should have bitten them in the ass big time by now.
If there was an iota of honest reporting the financial news talking heads would be going ‘transitorily’ crazy considering current economic trends.
Be suspicious…. very suspicious!
Dimon and his advisors are fools, its like excluding from your calculations, the possibility of a 1 in 200 event.
Well, its “almost always” been this way,….I am sure there were many times in Pompeei, when the mountain rummbled and belched ash, and people said “Oh, it does that from time to time, but it ALWAYS settles down!”
IMHO, the Brandon economy is one “WE” are not intended to recover from.
Spot on. The lessons learned going forward, will be remembered for decades. I doubt all the financial whiz kids have ever seen or imagined what is coming.
SD provides my favorite analysis on markets, Main Street, and Wall Street dynamics but even SD has to be thinking double and triple time, trying to predict how this will go. Slightly uncharted I will say.
JPM down to $108 from $174… 40% gone already. Dividend cut will be next.
and NO BUYBACKS.
let that sink in.
for reference , it was just one single lehman brothers that initiated the mother of all credit derivative swap implosions that literally shocked the entire financial global market.
we are entering a very similar crisis.
but far more devastating.
we are simply seeing the major investment banks and commercial lenders wearing the first patterns of a global contraction (recession becomes depression)
Absolutely correct. Equities, any equities, are not a good place to be right now. No one can predict the future, but if history is any teacher, opportunity will present itself sooner or later.
We have a long way to go….
Covid killed my business and now this nitwit fake president and his cast of clowns, are stealing my retirement…
And yet you managed an intelligible comment. You clearly don’t have enough rage yet.
Sometimes, after raging for a year or two, one gets exhausted of raging, and just states the facts.
What kind of jackass comment is this in response to someone who has lost so much?
It’ a liberal response from a troll who doesn’t understand how informed people are on this site. That’s the left for you. Yeah FJB!!! Yah!!! Derpity derp derp derp.
Sorry, DD. I have very high regard for my fellow Treepers, for Sundance, and the moderators of this site.
I strive to contribute and withdraw when I can’t.
FJB!!
Mea Culpa.
I’m here everyday seeing enormous damage to families through the lockdowns, vaccines, damage to individuals’ wealth, and destroyed dreams and I pray for them and share their angst.
How can Mack not be flinging sand into institutions that have harmed him? Fellow Treepers who cleverly manage to direct their rage and sand into redpilling every Lib in sight make my day.
I apologize for my unthinking clumsiness.
Please pray for my family members who blindly have taken the vaccines.
Done. Prayers list initiated.
They killed your business, stealing your retirement now, lying in your face about food and gas. The real kicker is… they are gonna impoverish your kids too, if you have some. Since when has America prided itself on the next generations living worse? America has always been a place where the next generation could live better than their parents. (Until Biden and Obama era it seems.)
Sam, and the sad part most of the idiots around us can not see the parallel between the Obama admin and the Biden admin. It’s almost identical with one exception- FJB’s is on, to quote Dark Helmet, “ludicrous speed.”
Probably because the Biden administration IS Obama. But Obama had to worry about “the next election” whereas Biden doesn’t even know when the next election is.
Obama worried about his image.
He hates Joe so delights in his humiliation.
Our April $30 lunch at the local tavern cost $38 today in July – same menu items. Head count at the place was pretty low, too. Thanks, Brandon. I hope you enjoy spending eternity in h3ll with your scumbag son Hunter and that pimp Jill.
Looks to me like their “strategery” is playing out just as they wanted…
Today, I got my canning done by early afternoon and decided to go get a couple of things at Walmart. Since I had time, I went looking at prices, something I haven’t spent any time doing in the last 2 months. I must say that while I have been eating out of my garden, there have been a good many changes.
It is easy to see how the current prices are hurting the quality and quantity that people can buy.
Suggestion add product availability to chart
Biden’s Energy Policies trigger higher fuel cost, resulting in higher manufacturing cost and higher transportation cost to produce retail products costing more.
Biden’s Energy Policies trigger higher fuel cost, resulting in lower wages since more income is directed towards food and transportation by retail buyers.
Lower wages are forced to buy retail products costing more. Resulting in fewer retail products being used. Resulting in higher manufacturing and transportation costs. Resulting in fewer retail products being used. Inflation!!
The product availability will not conform to demand. The amount of available fuel/energy determines product availability. You can demand all you want, but it does not mean you will get it.
No Fuel, No Availability
Always great comments from you.
But let’s not let them use Biden to escape responsibility!
It’s the Democrats energy policy!
or, better yet.….
It’s the swap’s energy policy!
D.C. thee Federal Government did is doing this to us.
our state’s have to resist.
As the constitution and bill of rights and laws have given us.
I think it is the Globalists doing this to us. They have purchased our corrupt politicians.
https://blog.whiteoakpastures.com/blog/the-farmers-role-in-the-food-system
They are fudging the numbers. If inflation were still counted the same way it was in the seventies, it would be 17-20%. As usual, the Democrats and the MSM are lying.
No energy/fuel available, no products and no inflation. Anything else is not realistic.
We are in the “perfect storm” of economic downturns.
All the signs are there, inflation, dollar devaluation, too much debt to afford higher interest, public and consumers who have had it too easy spending monies they do not have and a government whose solution is to spend, spend, spend.
We have a very weak POTUS and very active powers (Russia, China) who have an interest in weakening our economy and more dollar reserve system.
So yeah, perfect storm!
Retired Magistrate here: You can still find food items on sale and yes, there are still on line coupons and paper coupons available; use them.
Get prepared for Winter now. There are a lot of yard sales and estate sales this time of the year with quality items if you know what to look for. Stock up on sweaters, flannel sheets and blankets. If you heat with home heating oil (which we do) I suggest you fill up now while you can still get it. Don’t know what availability will be in the Fall.
Check out e bay for insulated drapes which will help keep the heat out now and the cold out in Winter. Don’t get depressed; get prepared. I remember what my parents told me about how they got through the Great Depression; they made do with what they had, had friends over to play cards, attended church and prayed a lot and survived.
We can do the same. Life is an adventure; sometimes an easy adventure and other times not so much. Keep your friends close, help each other and live your life to its fullest.
Great ideas. Yes, there are still food items on sale or at close to their 2020 price, even if they are getting harder to find.
Other places to look for finds at reasonable prices – thrift stores and consignment shops – and keep in mind Christmas presents when you are looking.
If this collapse is the chemotherapy to the cancer of Biden & Co, I’ll accept it until complete. Pray it doesn’t kill me in the process.
America is looking more like Venezuela by the damn day.
……and liberals just love Venezuela. They went, and still go, and praise the socialists and communists in charge.
Would those same liberals want that here?
Why would anyone think otherwise?
Admins:
“You can click on the graphic to expand the image and spend some time on it if needed.”
I don’t know if it just me but clicking on the graphic does not do anything, it doesn’t appear to be an active link.
In that case you should be able to right click it and select “open image in new tab’ where you can easily enlarge it.
Very helpful for tired eyes.
Thanks for the tip!
Try it again.
Ops Check Good!
Looks like an “October Surprise” at least for those not reading here.
Just in time for the November elections, ….if only we had candidates running, thay when we vote for them it would be a metaphorical thumb in the eye, to TPTB, or as I prefer TIIIC.
But WAIT, we DO! In Az, we have a whole slate of AmericaFirst candidates, endorsed by PDJT, and near as I can tell, not a WEAVIL or RINO in the bunch!
PDJT is coming to Az on Sat, July 26th, and will no doubt be repeating his endorsements,…KariLake for Gov., Mark Finchem for SoS, Blake Masters for US Senate, Abe Hamedeh for A.G., Wendy Rogers, Anthony Keen, Janae Shamp, David Farnesworth, for State Senate,…
I won’t cast my vote for a RINO, no matter who endorses them, but will be voting for this co-alition.
Hope others in Az will, as well.
That will be the 16th, Brother, this very Saturday!
President Donald J. Trump LIVE from Prescott, AZ July 16th, 2022
This is a slate of candidates I am looking forwards to hearing, especially Kari Lake, who I will be looking forwards to seeing as well . . . 😉
Wait … so these PPI inflated prices haven’t even HIT the consumer market yet!? Yiikes!! Batten down the hatches. We’re all gonna start doing what what my local (Concord, CA) Home Depot is doing … locking up every valuable product … like all electrical wire … behind steel cages. You need HELP … picking up a roll of Romex now …
Recessions are always only identified ex post facto.
Thats the way economics work.
So, saying we are in recession, before we are FED approved to be, will catch you flack.
We are, however, in a recession.
Everybody knows it.
You don’t have to have an MBA to see what’s going on.
I think we are at the front third of a global recession.
In the first third, you’ll see lower production, and higher prices,
because production is looking ahead, and consumers haven’t caught up
The middle third is when the consumer reaction occurs.
The consumption of everything will slow, because of price inflation.
Thats where we are headed immediately, if not there already.
Teh last stage is an equaling of consumer pricing and producer costs.
Its the stage where non productive companies realize they are not financially viable,
land they close down. A new pricing paradigm comes into effect.
Eventually, the production costs will meet the demand costs,
land we will start all over.
A 92% approval rating for the most popular US president in history. #0bamagate
Everyone keeps talking about the inflation cost year over year. I would like to know what the inflation cost is since the Nov. 4, 2020 election date until today. I’ll bet that number is up around 18-20%. Anyone know how to calculate that?
So, the decline in prices you forecast for late summer will benefit these idiots. People see prices drop and they think, “Well, it’s not so bad.” Maybe that moderates losses for the evil trolls in DC??
Looking at just some of the issues fuel, fertilizers, increasing energy costs and supply chains, they look to interlock sometime this fall. A well organized collapse. The fly over country should get bye but god pity those in the cities, and on limited incomes.
I like this website its a master peace ! Glad I found this on google .