This is a stunning video and represents the best presentation to show how the 2020 election was determined; not by actual people voting but by algorithms inserted into election tabulation machines. {Direct Rumble Link}
Dr. Douglas G Frank explains information he discovered as he reviewed election outcomes. Dr. Frank found the baseline for the 2020 vote was created by applying an algorithm that used the 2010 census to fabricate the illusion of registered voters at a state level (predetermined) and then results are controlled at a county level.
Every state is impacted, and every county within the state generates the exact same age and voter registration ratio. So far they have identified 3,006 counties with the exact same predictable voter outcome and ratio. This really is a must watch:
Wow.
Maybe this Census info was the voting lists Bill Clinton was asking Obama for…..pre 2016 election?
Remember Bill Clinton was upset Obama would not share? Discussed while playing golf?
It is mathematically impossible each county in each State would have the same percentages.
The same percentage in every age group by years, in every State, 83x?? In every County in the State?
Impossible.
Why are we even auditing the vote when it was predetermined?
It is impossible and the fascists know it. The jig is up. But this will not be resolved in a normal way. A storm is coming because the Left wants to destroy America. They are in the process of doing this.
Dr. Douglas G Frank with his patriotic bow tie presents no “stunning” evidence of fraud in this video. All it is is presenting a normal expected correlation in the number of people voting in each age group with the number of people existing inbeachbage group by census. You may see this as evidence by confirmation bias if you thought the election was stolen before seeing video. It is perfectly expected to see voter registration correlated with population by each age group. Each age group best estimate is cencus plus 10 years minus mortalty. A high correlation with voter registration and actual voting is expected and normal. Nothing he presents is evidence of fraud. The level of math is not even eight grade audience designed.
Give you example, suppose census data by age group is highly correlated with the number of people who smoke for each age group. You would expect that the percentage of people who smoke by age group to be highly correlated with the number of people in each age group who get lung cancer and die each year. Now does that prove that the data on the number of people in each age group dying of lung cancer is fake since it correlates with census data on the number of peopke in each age group. It is a ridiculous argument and confirmation bias if you believe, hey gov wants to fake and inflate cancer deaths to get people to quit smoking. Suppose I present same census data and number in each age group and then show the percent of each age group female and a .98 correlation, then I say that is evidence of fraud and the number of females in each age group was manufactured based off census data?
Dr. Douglas G Frank who gas a PhD in chemistry and does not even use intro course statistics and presents no evidence of fraud in this video. He just presents an expected correllation in census data, voter registration, and voting. I would expect the same correlation in every county in America to be similar to Ohio, and same for last 20 election cycles or wherever data was availiable. I could test, but not worth my time. You should get a slightly better correlation with 2020 census data not availiable prior to the election and voting data by age group than with the 2010 census he uses. I dare anyone to do this. If you get a statistically significant higher correlation with 2010 census data than 2020 with 2020 voting, I will eat my words. He is only presenting a normal expected correlation and then claiming fraud without doing any real statistical analyis. Frank is preaching to choir, confirmation bias if you can something, it is really quite laughable.
I am not saying fraud did not happen, but more in form of unverifiable mail in ballots in bulk anyone could fill out and drop off no ID, fake addresses and ineligiable voters, violation in law on verifying signatures, cut off times in voter registration and voting ignored, people voting for others since no ID required, ballots counted twice and others not counted at all, ballot harvesting, but Frank presents nothing.
The symposium is three days long.
Tons of newbie trolling going on at the CTH lately.
I will be nice and ask if you are one?
Nice WALL of text by the way.
Been here a few years, good detailed info normally here, Russia gate high quality, no MSM propaganda, but watching people like Frank with a slick vid designed for believers just gives creed to other leftists that people who claim or believe election fraud are conspiracy theorists which is incorrect. I do believe fraud occured, mainly due to use of mail in ballots which is almost undetectable since you cannot verify anyone’s vote as private (voting was public before civil war, your name and how you voted was public info anyone could see). Frank by asserting an expected correllation between the number of people in each age group by census with the number of people voting in each age group is a rediculous argument that the latter was somehow manufactiured from former or fraudulent, it is laughable. I have a Ph.D and have about a masters degree equililant in statistics from one of those ivory tower places, go show Frank’s video to anyone you know who has taken say just three undergrad stat courses or can give you formula for correlation without looking it up, they will likely come to same conclusion as me, or worse they end up thinking all that those that believe that Frank presents good evidence are same as QAnon followers or believe in aliens and pizzagate. Frank is marginalizing whole group here and likely makng good money on doing such preaching to choir. This is not evidence of election fraud. Confirmation bias is a big thing.
Really?
Here a few years?
More like hit and run horseshit. If you have been here as long as you say you know that walls of text are obnoxious as well as against the board guidelines.
Not buying it. I rarely use the RolCon accusation, but your crap sure smells of it.
He’s been here since 1/8/21…. not even ONE year. Not any more. I hate liars.
Thank you.
If anyone believes mail in ballot fraud cannot be detected there can be little doubt why the Dems demand it. But there is no connection with fraud, none whatsoever. Thanks comrade for another Fauci like explanation. How long did you understudy Baghdad Bob?
I think what you may be missing in this presentation is that Frank isn’t asserting the a Trumpian conspiracy. He’s not identifying that votes were cast in excess for one candidate or another. He is simply showing that the voter participation – which importantly includes the specifics of voter age – is aligned to a specific algorithm in exactly the same way in each county in any given state.
I don’t recall that he mentions in this presentation but I am aware that the graph he presents for the distribution of registered voters by age is taken from the Voter Registration Database of the specific counties. The second graph showing the distribution of the vote by age is also taken from the final ballot tallies. He does not identify for whom voters cast their ballots – he’s simply telling you that the voters by age group in each county cast their ballots in a manner that aligns with a program/algorithm.
It is anamolous that any age group would vote county by county in the same proportion – particularly given Covid restrictions.
Campaigns are won/lost based on turn out. Vote efforts target groups – the suburban mom, the youth vote, the minority vote, etc. He’s identified that both the voter registration and voter turn-out in every county follows a consistent pattern in the category of age. An algorithm based on age that aligns with ballots cast in every county is a huge red signal that something is wrong.
It would be nice to see comparable plots for elections where there was no such cheating.
You clearly do not understand Math then. Watch out for the Liberal trolls and FBI undercover thugs.
I was about to say the same thing. This commenter, JPinBalt, is new and based on his comment- doesn’t understand correlation or statistics. Moreso, for it to be happening in all counties in multiple states.
Ron, you’re right. JPB does not understand math. JPB thinks he discredits Dr. Frank as a mere “chemist”. Actually, Dr. Frank did advanced research in materials’ surface phenomena: that was PHYSICAL chemistry, requiring expertise in physics. He’s an expert in Augur spectroscopy, originally developed by physicists.
Dr. Frank published a report in the esteemed journal Science, and not only that, his work was given a cover illustration, demonstrating the importance of his report that Science‘s editors and peer-reviewers attached to it.
JPB abjectly overlooks Dr. Frank’s documentation that for each state’s voter-registrations by age (lower percentages for teenagers than 60 year olds is no surprise), every county within that state had the exact same by-age voter-registration percentages.
Dr. Frank examined many states. The states’ by-age percentages for voter registrations were not identical, although they were understandably similar, with young people not registering as often as middle-aged people and seniors. However, in many states examined, all their counties had the same uniform set of by-age registration percentages as the entire states.
If JPB understood math, including that beyond the “intro course statistics” principles he/she believes himself/herself to comprehend, then he/she would admit the statistical impossibility of multiple states’ county-by-county-by-county uniformities.
I am a skeptic by nature. Dr. Frank is a “colorful figure”. If his claim about county-by-county by-age voter registration uniformity is proved to be a charlatan’s fabrication, I shall denounce his chicanery. His claim is a matter of public record. Voter registrations are a matter of public record. His supporters, enemies and neutral parties will either affirm or disprove his claim, and we shall see if it stands as correct.
Funny, you say I clearly do not understand Math, and do not mean to brag, but scored 1st year college equilalent in math while in 5th grade, then 97th percentile in math on GREs. Maybe you made a mistake and meant I did not have English or gramatical skills where I would agree being below median and evidenced by numerous spelling errors.
Don’t feed the trolls, especially the ones that have to prove they are smart rather than have smart conversations
I don’t care if you could do algebra in the 5th grade (*) in the US, and “first year math college equivalence” is a meaningless term. Students going into Sciences and Math go into college with at least some first year Calculus, but political ‘science’ students are lucky to have completed Geometry.
The kind of “math” we’re discussing here is twofold:
(1) Statistics using polynomials and numerical analysis ( Junior level in a university ).
(2) Analysis of data based on the Western Empirical Scientific method. ( Ie: Independence of data sets).
That, my friend, is a different level of “math”. In fact, it takes a scientist who is used to applying rigorous mathematical analysis to data sets to fully understand. A mathematician is unlikely to do such since they are always dealing with theoretical, representative data sets.
(*) I come from the Old Country… we learned multiplication and division tables in first grade, arithmetic in the second grade, algebra in the THIRD and FOURTH grades. We were doing geometry in the 5th grade and trigonometry by the 6th grade. So there… When I graduated from HS in the US, I had completed Linear Algebra and three semesters of Calculus at a college level.
You say that as if it’s impressive, that alone says enough for anyone wanting to evaluate your aptitude in this subject.
Sure you did. Now tell us why you failed the 6th grade because you you were unable to count the number of students in your class. By the way tell us again how you scored in the top 1% of all cockroaches taking the GREs. Your claims ring about as true as Biden’s claims as having graduated with three majors and in the top 10% of his law class.
Frankly its probably your test scores were achieved in the same way Teddy got his college test scores.
Ok discount Frank. What do you have to say about the other mathematicians and the cyber experts who found the deleted logs? Dominion is in heap big trouble and Lindell may be credited with saving the Republic.
Nobody cares, 2 strikes you’re out!
Boasting doesn’t make us believe your statements. However, as the only qualification I have to refute your arrogance is shepherding my children through school, I submit that it is not logical that you, in fifth grade, were given any test at college level. Tests aren’t like that in American education.
I hardly think that old test scores amount to much. It is a test. Not real life. My husband, who was too hungover to comprehend his college entrance exams is exceptional in his field while his wife scored far better and has no field or income. Your lack of life experience is showing and your argument has lost its way.
I watched the Dr. Frank video with great excitement! Those graphs obviously, to me, showed something not right going on here. However, after watching it over again, the thought hit me: “This is very strange and probably been “worked” by machines, but…..how does that show the VOTES were changed or added to steal the election?” I wish there were someone who could show that the votes were changed or added in Biden’s favor. The video of the vote-counting place where the boxes were taken from under the tables after the Republician vote verifiers were ushered out would make most Americans take notice. But not the Dems. For them, winning at any cost shows lack of integrity and good conscious.
How would you explain the voter registration exceeding population that Dr Frank presented on some states?
If a state leaves people on voter registration rolls when they move out if state ir do not remove them when die which is common, then reg can exceed pop estimate. States need to be sued to remove dead voters. About 10% of counties in US have more voters than eligible voters. https://www.judicialwatch.org/press-releases/new-jw-study-voter-registration/
Strange how some states refused and still refuse to clean up their voter registration rolls and how the Dems do everything in their power to insure this is impossible to do. Because they wish clean elections as you undoubtedly do. Cough, cough.
Yeah, especially since the Brennan Center claimed that voter registration had plummeted in 2020 compared to 2016.
https://www.brennancenter.org/our-work/research-reports/voter-registration-has-plummeted-2020
Except oddly enough in Alaska? Where voter registration apparently skyrocketed to 85% of 2016? What happened, Alaskans?
You make a lot of suppositions with no facts to support. The simple answer would be to audit the election results to put all the deniers to shame. How come you don’t support using truth to expose the lies? If you have nothing to hide, then let’s expose the deniers as fools, right? Right?
I completely support auditing all election results and using 100% paper ballots. I am not arguing that the election was not fraudulent or presenting facts to support that. What I am asserting is that if there are more people in an age group and a correlation between that and the number of people who vote in an age group, that is completely expected. It is the same as you would expect electricity consumption to rise if population rises in a county. I like facts. A correlation does not mean causation, there are statistical tests from normaly expected populations and variables, t-tests, confidence intervals, Frank presents none of that, not a single statistical test. A very high correlation between the number of people in each age group and number voting in each age group is 100% expected and not evidence that the number of people in an age group by census was used to manufacture votes.
I will make it simple. Look at the Frank video again, replace “voter registration” with “automobile registration” by age group, and replace actual “voting” or “ballots” with “automobile accidents”. Now after doing that substitution, does the video convince you that if an age group has more cars registered, and that age group with more cars also has a higher number of accident so a high correlation exists between the number of registered cars and number of accidents, that data is eiudence that car accident data is fraudulent and manufactured based on car registration data? Would you realy think that?
I agree with the basic critique in your first paragraph. That said Dr. Frank does “seem” to have more data and more proof than you mentioned. You fixated on one element of his video. I want to see the data and Dr. Frank’s calculations, as verification of data is always essential.
Don’t feed the trolls
I think I’m wasting my time here…
We are discussing the correlation of the voting data sets IN ALLS COUNTIES WITHIN A STATE.
And the fact that the data in ALL FIFTY states contain the same data anomaly -the correlation.
Everything else, your arguments, etc… are non sequiturs and logically fallacious.
I’m carefully considering your points. I haven’t rejected any of them.
But this comes to mind. I would expect people voting to correlate strongly to the voting population. The problem is that they seem to correlate strongly to 10 year old census data. Surely, state populations and demographics arent that static?
There is no surprise that exactly the same results would apply exactly in various states. I mean who would expect otherwise. Don’t the voters in NY and Alabama vote the same way on the same issues?
I’m not sure what you mean, but Dr Frank was pretty clear in his explanation that the ratios were different from one state to the next, but were exactly the same in every county within each individual state.
The graphs show possible voters by age. Not how they voted.
I think you may have missed the part where he advanced all the statistics ahead by 10 years to more closely reflect the 2020 census. But, I may be wrong.
Pinball again demonstrates the logic of a drug addict, the morals of a lawyer, and the ethics of a whore. So Pinball how long have you been a Sciology teacher?
You have already been outed as a liar.
Just stop already.
He just showed that voter registration is falsified in predictable patterns. They are rigged. They are fraudulent. And that is the for each state he has tested. Trump states and Biden states.
And he has very strong proof.
He also showed that voter participation is falsified in predictable patterns. That too is rigged and fraudulent. And is based on equally strong proof.
He hasn’t shown the outcome of the vote, but he has shown that massive fraudulent voting occurred, based on predetermined algorithms.
This is very different than someone stealing the ballots from a nursing home and filling them all out. This is also different than kicking out observers and pulling out suitcases of fraudulent ballots. And it is different than running the same ballots thru twice. Lots of different ways that they did use cheat.
This is someone deciding what the real votes ‘should be’ before the vote happens. To do so, they decide what the voter registration should be. Then they monitor the vote live and ‘modify’ the vote to get what they want. And fudge the registration data to make the vote data look acceptable and not be found out. (He said they saw these modifications but did not show proof.)
But they made a mistake to use the same algorithm for every county in a state. Changed the algorithms between states, but thought nobody would look deeper in the data.
They also, prevented the users from looking closely at the data. Thus further hiding their fraud.
Real life numbers never work out that way. It would help to use 2020 Census data to show how predictions from 2010 census data never quite get it right. Some overpredict, some underpredict, but there is never a one size fits all correlation for each county.
That is very strong proof. Proof of massive fraud.
But, it begs the question, why did they have to shut down the count and do massive cheating in preselected counties in six states in order to win? They should have succeeded with this technique alone.
And, it shows that they are already able to predetermine the result in advance for each and every house member in 2022.
Maybe they feel there is a limit to how fast they can move the results without being caught.
Maybe the Trump vote still overwhelmed their predetermined ‘results’.
Bingo- Leftist plants show willful ignorance, time & again. They stand out like a sore thumb.
Jim, bingo.
Dr. Frank is giving us the why. The why to the discrepancies the AZ audit is about to disclose. The why in MI regarding why counties had over 100% voter participation rates (more voted in than live in the district) in some counties.
Dr. Frank is an outstanding man.
Jim in TN: “But, it begs the question, why did they have to shut down the count and do massive cheating in preselected counties in six states in order to win? They should have succeeded with this technique alone.”
See my comment here as to why this became necessary. Let’s also understand that Dr. Frank’s analysis is only a piece of the puzzle — a very important piece — but only a piece nevertheless.
A complete end-to-end picture of the 2020 election steal must be assembled from all the facts that are currently known. We aren’t there yet. But Lindell’s symposium is a good start at creating a complete picture of what actually happened.
I’m guessing you stayed in a Holiday Inn Express last night.
“…why did they have to shut down the count …?”
I was thinking about the same thing earlier.. My though experiment yields that the voting margins for Trump exceeded their cheating margins so they had to think about it and then calculate a new rate increase for the allowable percentages of fraudulent votes.
This was their crucial mistake… shutting down and then massively making vote dumps in a few discrete steps.
The scale and temporal nature of those vote dumps was simply too great to hide… unlike the insidious schema they had in the beginning which was hidden in the continuous data stream.
That was clear panic… and triggered the analysis of the vote data.
Did you watch the engineer this evening? She explained it very well. Each state had an end point the machine was going toward. Texas and Florida were to go to the Usurper. But the numbers were so high for Trump that they broke the algorithm. So then they had to stop the count in a few other large states….rework it and pull those states out ahead for the Moron in chief.
And get ballots to match the vote. They still couldn’t get enough.
In other segments with Frank and other analysts it was because South Florida went for Trump SO much that it ate up their “credit line” of votes. So at that point they had to call Arizona and shut down the swing states to recalibrate.
Jim, they had to stop counting because they didn’t have enough ballots ready to be scanned. I think they had to make up such a large gap that they were not prepared with enough ballots to match up.
I think the gap was a lot bigger than they anticipated and that was with taking into account 2016.
I think the Dems had the cheats all set but were surprised at how well Pres. Trump was doing. Actually out-pacing their cheats. That’s why, in my opinion, the all-out crush of bogus votes coming after the counting offices were “closed”.
Willful ignorance
Prove him wrong! $5,000,000 not worth your time? Okay, you are not very believable either.
EE here. I get your point but disagree with your conclusion that he showed nothing but normal correlation. Consider the combination scenario – what was it? – the 81 rolls, i.e., the turn out by age group adjusted by the 81 points of X percentage turn out factor by age groups. If your theory was correct – this is just a normal (not manipulated) correlation between age, census data, and turn out – it would expect to show a stronger normal correlation via a regional match for example between two very similar counties between ohio and an adjacent county in Penn or Indiana. But that was NOT the case. As presented, each state has it’s own unique 81 point key combination, and it’s different for each state but is the same within each county in that state. If this were just ‘normal’ correlation – your theory- then the 81 point key combination would have a strong regional match, NOT as shown as a unique state combination signature. In other words, if this were just normal turn outs, a farm county in Ohio would have a strong combination key match to the adjacent farm county in Indiana. But it does not (at least as presented). In contrast, as presented, that farm county in Ohio has a strong near perfect combination key match with all the counties within the state. And the adjacent Indiana farm county is diverging from that Ohio county and following the unique key combination for Indiana. That, in my informed view, IS showing something very fishy. Do we know where we can get his dataset? Because with the dataset we could disprove your null with my regional example given above.
“Do we know where we can get his dataset?”
Supposedly 37 terabytes of data. Claims during his talk that what could be called authorized “honey traps” were set with machines thoroughly checked before the election, all I/O monitored during the election, and analyzed for tampering after the election.
If this is as worthy as it seems, I would expect to see a peer reviewed paper based upon the data. Such an extraordinary claim requires extraordinary evidence.
He also points out something which I can easily believe: voting machine pre-election inspections and certifications are typically a joke with all kinds of dependence on TRUST rather than deep inspections along the way and even if the machines were opened up those typically involved wouldn’t know what to look for or understand what they were looking at.
Honestly, how about using paragraphs?
“I would expect the same correlation in every county in America to be similar to Ohio”
How do you explain the percentage of turnout among 83 different age groups of voters, while different for each STATE, is identical in every county in every state? i.e. the percentage of (X) year olds who actually voted was the identical % of registered voters who are (X) years old in every single county in the state of Ohio. That’s mathematically impossible.
You are absolutely wrong.
The point is that you can not have the correlation being the same across ALL counties in a State.
The CORRELATION between the census and the voters can not be CORRELATED across all counties… it must be INDEPENDENT.
THAT is what you are ignoring.
Did you study statistics at all?
I did, I am a physicist.
Dr. Frank teaches mathematics… I know many chemists who do physics and math extremely well. So your attempt at disqualifying him via ridicule is logical fallacious.
Every one of the 83 single year demographic groups from 18 to 100 had the same percentage of registered voters across every county in the state. To suggest that such an outcome is natural and expected is beyond ignorance of statistics. Add to that the fact that all the other states also exhibit the same phenomenon (but with different percentages) is well past ignorance and into abject innumeracy. Take one age group example in one state: TX has 254 counties. Imagine that in every one of the 254 counties the percentage of registered 50 year old voters was exactly 10 percent of the county population. Now imagine that the same was true for every 18 year-old, 19 year-old, etc. throughout the state.
How big a moron would you have to be to believe that such a thing is possible, let alone expected.
You accuse Dr. Frank of low level math even though he referred to the excel spread sheets and using 6th degree polynomials. Remember, this was an “in the nutshell” presentation so everyone could understand it and fit in the time allotted. He is a physicist. Obviously he has high level math credentials.
Second, you say you could disprove him but it’s “not worth your time”. Really?! 5 million is on the line if you can disprove him! Then you dare anyone else to do what you don’t have time for.
Thirdly, those high rates of correlation are impossible. That helps explain why there were as many as 50 updates of votes in a county in a row with the exact same per centage to two decimal points. Something like 51.05 Biden to 49.95 Trump. 50 times in a row? Only with an algorithm to maintain the lead after ballot dumps gave Biden the lead.
Anyone who believes JPinBalt should immediately invest in my time share condo in beautiful downtown Port au Prince. You have demonstrated the intelligence, education, common sense, and knowledge to comprehend the incredible investment potential of these condos. For a mere 1.1 million you too can own a two week time share in sought after colonia Muerte a Todos, after all you have the intelligence required to buy what Balt is selling.
The same percentage in every age group by years, in every State, 83x?? In every County in the State?
Impossible.
Well, how about this…..
Many American Citizens saw with their own two eyes, as I, on election night in real time thousands upon thousands upon thousands upon thousands upon thousands of votes for President Trump taken (stolen) and the exact amounts switched and fraudulently given to Biden!
So, ‘NO ONE’ can cast a shadow of a doubt or a seed of doubt! The election was arrogantly with evil intent flagrantly right before our eyes stolen!! I don’t need any further evidence….my eyes tell the facts and what was seen was treason….so obviously and blatantly done for all to see!!!!
“Every state is impacted, and every county within the state generates the exact same age and voter registration ratio. So far they have identified 3,006 counties with the exact same predictable voter outcome and ratio.“
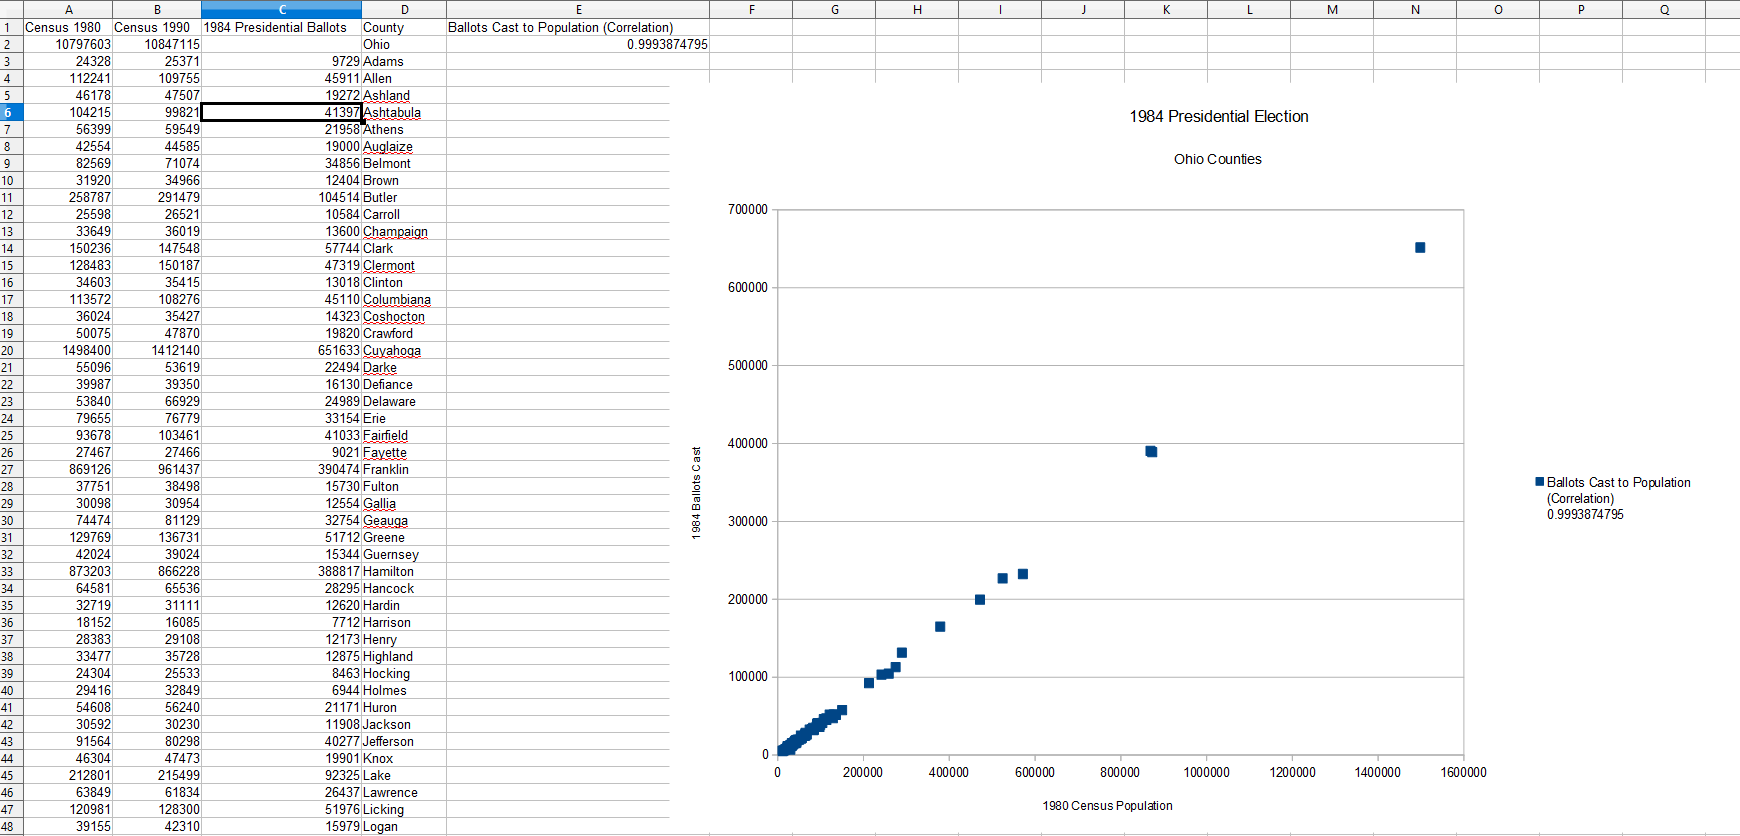
I analyze the 1984 Ohio election results versus the 1980 census by county.
This predates the use of electronic voting machines and any internet connections.
I voted in Ohio for Reagan on punch cards.
I uploaded the OpenOffice spreadsheet here:
https://1drv.ms/x/s!AjFjoQZ2Qgm7iXoi8iOE-SjQi7LP?e=dDLnpO
The correlation is .999387479
Dr. Frank apparently doesn’t understand the meaning of Pearson Correlation.
Please explain what you are saying and how this obviates what he is saying for the simple minded among us; myself included. Can this be peer reviewed if you can find a few honest people that understand this stuff?
If you run a correlation on two sets of variables where one set is a total and the other is a part of the total, you will get a very strong correlation. In this votes cast (a part) versus registered voters (the total).
See item 5 in this section on misuse of correlation:
https://online.stat.psu.edu/stat509/book/export/html/788
Wow. So you’d expect every county in a state to have the exact same percentage of registered voters by age? Seems impossible.
I’m not buying this. Statistical analysis was presented in the original video with Lindell & Dr. Frank:
If you can answer those questions, which you haven’t,
Now, I do agree that we should run this same “discovery of correlation,” if I may, against 2020 census data, once that’s available, as well as against the census data-to-election data correlations of previous decades. These should prove to be litmus tests for both Dr. Frank’s statements, and your own.
Think you missed a few points in the presentation. It wasn’t just about the math. Pay more attention to how and when the voter registration databases were mysteriously updated. And the part where EVERY county in a particular state had the exact same percentage. He didn’t just do Ohio, he did like 20+states. And if you are a math genius as your posts suggests, then I don’t have to tell you how statistically impossible that is. Not just improbable, but impossible! You also missed the part where after he did the math, he compared it to the numbers of what the cyber team actually found and they were almost a perfect match! So in summary, the actual fraud numbers the cyber team found validated Dr. Frank’s theory. That would be statistically impossible as well if we used your logic. Watch the entire symposium if you haven’t, and maybe rethink the position.
But we have it!
New commenter here, but previous analysis from BEFORE Jan 6th showed tons of counties with the exact same ratios for Trump / Biden – EXACT ROUND NUMBERS in the same ratios on the county voting totals. County after county.
BAK USA was part of Cuomo’s NYS Buffalo billion$ Economic development program. Regional economic development programs were Hochul’s baby.
BAK USA received $$$ from Hunter Biden’s Rosemont Seneca that came from Moscow mayor widow Yelena Baturina according to the Congressional report.
BAK, now bankrupt, assembled tablets from Chinese components. BAK tablets were a component in Robis Elections ASKed e pollbook systems (not ES&S as I’ve previously posted).
https://votingsystems.cdn.sos.ca.gov/vendors/robis/robis-staff-report.pdf
Were any Robis ASKed pollbooks used to max out voter registration rolls in 2020?
I’ve recently started reading the Patel Patriot blog, thanks to a recommendation posted here. It also offers hope that there was a patriotic team on top of this, and using the election steal to force all the Deep State players to reveal their knowing collusion with China in its act of war against our elections. Check it out if you. But I fully agree with Dr Frank that we the People need to start making noise. I’ve volunteered for the first time to serve as a Republican poll observer for the September 15 recall election in California. I’m hopeful that Larry Elder, a very intelligent and funny African American Republican with a hugely popular radio show in LA who jumped to a double digit lead over pack of replacement contenders, when he announced at the last minute, will win and lead a large portion of the A-A community out of the Democrat bondage.
I found this fascinating…and I believe it to be true…but it was not proof.
It was NOT clear to me from info presented that the election results could be reverse engineered to the adjusted 2010 Census demographics by State.
It was NOT clear to me that each county in each state could be proven to have same age /voter demographic as the adjusted census number for the state.
He has the data I think BUT IF he could show that for each STATE each COUNTY has same result after the ‘6th order polynomial (whatever that is) is applied then it would convince me.
Also…not a maths at all…I have to rely on just my common sense…let me play devils advocate>
He has X (the census data/max voter data ) and and then just creates other data by assumption I think (registered voters ?) , voter turnout assumptions ? and has actual results.
He compares the 2 (input and output) and finds they are highly corelated after applying a key to each state based on a reference county in that state. but… soory , it just loses me.
I need a second visit to this.
P.S. if true> these men are heroes and I offer my utmost admiration . But it is too complex for me to follow still ( and yeah I have an engineering degree).
My gut feel is that if proof exists that all counties in each state behaved/voted in a highly correlated manner (R2>0.95) it proves vote fraud…something was in control.
But I don’t think that happened.
The willfully ignorant are the reason we sit here today- Just saying.
The Commierat song is yeah we stole the election now prove it. Well it should be demonstrated. Then trials held for treason with the maximum penalty levied for participation for facilitation of it or excusing it.
Well they proved today in real time that Dominion is wiping all the machines…….that should start the ball rolling for Audits….and place a few people in jail if we can find an honest judge.
Are there computer hardware pros here? What kind of computing power is required to pull off the data adjustment in real time demanded by the algorithm described by Dr. Frank? Who, or which agencies, or which country in the world, has that kind of super-computing power, or only a desk-top or arrays of desk-tops could perform all these tricks in real time? Answers to these questions may narrow down who’s behind this steal.
This is a by county SQL edit. Some counties have 100,000’s of citizens, but most are 50k or less. A laptop could handle any one county.
You would likely need a decent server to process an entire state’s data, but those are rentable by the hour from Amazon. And Amazon will delete the entire Server, with zero history of it when you either aske them to or stop paying.
Getting write access to the voter db is the hardest part of this. Anyone with any SQL training at all could pull off what he is talking about. It just isn’t that complicated.
I have 25 years experience in IT.
Thanks! What if handling the different algorithms in all 50 states and all 3500 counties and making adjustments in real time at the same time, or in the six or seven swing states? Do they need more computing power to coordinate all the data coming in in real time to fit into all 50 different algorithms?
Actually, it’s all highly distributed and the amount of data that needs to be transferred is minimal.
The counting machines have the algorithm, all they need is some of the factors. Imagine an equation:
F(x) = ax + bx + cx
The counting machine does the calculations… the ‘network’ connection just needs to supply the coefficients A, B and C. The coefficient can be tweaked real time but that’s not a lot of traffic.
The first tier deals with the raw votes and creates the total vote counts… the second tier machines just deal with the total vote counts… a third tier machine can then cross compare the counts per county/state/nation.
It’s an intriging hypothosis. Dr. Frank could greatly strenghen his case by looking back several decades to show that these close correlations with the census are something new – that has only happened in the age of computers.
Presumably the same algorithms were in use in 2016, yet Trump was allowed to win that election. If the algorithms were only put in to place post-2016, it should be easy to show this by comparing the correlations between 2016 and 2020.
I think Trump was unexpected.
The cheating in place to support Hillary was insufficient to stem the Trump vote.
In ’20 they implemented a 2nd layer of defense ( massive cheating and propaganda to cover it ).
Hmmm- maybe/maybe not. Globalists have gotten a lot of mileage out of Trump– no rule of law/order in any branch of government right in front of our faces, pravda media, a fake pandemic using biowarfare to enable totalitarian tactics, a divided and conquered populace, and a coordinated gaslighting by government, big business, big tech, big pharma of dissenters to all of this.
I think you confuse Trump with Obama/Biden.
First would be to figure out how accurate projections from census are compared to the next census. Cheating based on 2010 census data in 2012 should be much more accurate than cheating based on the same data in 2020.
But yes, going back over time and establishing the variations and their range would be useful, but would massively delay the work. Also, is the voting data even accessible from Carter beating Ford, or Reagan beating Carter?
And, network and computing capacity is discussed in other comments, but one can estimate when this would become possible. And the extent of these particular machines over the past few elections. Maybe even find if some states which had other devices had other statistics.
Lots of possibilities here.
By the way, Trump wasn’t allowed to win in 2016. Hillary’s last minute ‘stop the counting and cheat’ failed in 2016. Our massive vote overcame their preplanned cheats. So they upped their cheating game for 2020 to get rid of Trump.
And, to make sure she had a true majority and a ‘mandate’, she put massive efforts in running up the vote in CA and NY where she could get away with cheating. Stupid hag. She already had those electoral votes sewed up. More effort put into swing states might have made it close enough to cheat.
I did that.
Nuts…. what I don’t understand is how lazy the thieves were.
I mean, “election stolen by a Excel spreadsheet” ?
A single key for each state?
You realize how easy that algorithm is? Didn’t they have some real scientists/mathematicians in there to say: “hey guys! we should have a different key for each county?”
I guess political ‘scientists’ don’t understand math and they made it soooo easy.
Now, the “drops” in the middle of the night from those states that stopped counting at midnight can be easily traced as well.. and then you can tie in the actual vote. Oh boy.
It’s not that they are lazy. Or stupid. Far from both. This took a lot of work and the algorithm is not a simple equation or process. They just didn’t think anyone would be looking before, during, and after.
Remember the Dems were shouting this stuff post-2016. Even in 2018. Then, poof, they stopped talking about it. This includes Kamala. She was one of those leading the charge regarding the machines. Now…..nada.
They just didn’t think anyone would look. They fail to understand that us freedom-loving types will keep digging until they are completely buried.
At this moment these bad actors are rewriting their algorithms o be more confusing
If all this and other audited material in at least 8 states are true why have not the cowardly GOP arrange a court case to go before SCOTUS and force those people to make a decision on the 2020 election??????
Because they are cowards. Cowards don’t take stands or force peoples hands.
The RNC power players are in on it.
I recently heard this: Men of action tend to lack wisdom. Men of wisdom tend to lack action.
Dr. Frank does not have time to do everything, but it would quell some lines of doubt for him to do similar analyses for, let’s say, Ohio’s counties for several different election years — say 1988, 2004, 2008, and 2018. Would it show the apparent application of the same ratios for each age throughout every county?
It is encouraging that he has worked with numerous election officials who seems cooperative. Dr. Frank says that these patterns show up in every State and county. How about picking a state that Trump won, and working on the SoS, the AG, and friendly election officials to actually investigate whether a crime occurred, using Grand Jury subpoena power? (Possibly something like that is what he refers to as meetings with Supermoms). The side issues about decertifying or overturning the election will not exist. Do it quietly to deprive the media of things to whine about, and accuse no one publicly, until hard proof is in hand — and it sounds like Dr. Frank has election data files that provide that evidence. State AG’s ought to be begging him to help them.
Dr. Frank makes the complex simple. What a dedicated man to truth.
The “crime of the century” has been committed against the United States of America but almost the entire federal government (and many state government organs), the mainstream media, the Democrat party (and RINOs), the academic domain (kept Democrat through bigotry similar to that exercised by the Communist Chinese Party in actively working to prevent non-Marxists such as conservative Christians from entering, working in, and advancing in public K-12th and higher education) denied the truth and then misused their power to target American citizens for pointing out that this terrible crime actually has occurred.
As if that isn’t completely unacceptable in and of itself; the result is a decline into economic stagflation, spiraling government debt, government totalitarianism, rapidly increasing social crime and anarchy, immigration chaos as the least desirable immigrants and foreign criminals stream across borders this administration deliberately broke after their ascendancy through the greatest criminal election fraud ever perpetrated upon the American people.
ALL bad. EOM.
(Revised transcript)
Here is a full transcript I’ve put together (w/ timestamps) of the presentation Dr. Douglas Frank gave on 8/10/21, the 1st day of Mike Lindell’s Cyber Symposium. (A few minor words have been omitted.)
♦ Stunning Video Explanation – Dr Douglas Frank Shows How The 2010 Census Was Used to Create the Algorithm That Fabricated the 2020 Electronic Vote Outcome – Sundance
2010 census was used to fabricate & inflate the 2020 vote
https://rumble.com/vkynsx-2010-census-was-used-to-fabricate-and-inflate-the-2020-vote.html
Transcript:
0:01 – So here’s how our elections are being stolen. In a nutshell, this is how our elections are being stolen.
— Someone before the election decides what they want the outcome to be. It’s a decision ahead of time.
— And then they make projections and they say “Well, we think this is what’s going to happen…”
— So they want to regulate that at a county level to make sure they get the outcome they want. So what they do is they inflate the registration databases.
0:30 – Now this is before the election, and during the election, and after the election they’re manipulating the database. But beforehand they make an estimate of what they think is going to happen and they inflate the registration databases.
— So the beginning big hack… most of the hack of the election… takes place at this point beforehand. They inflate the registration databases.
0:51 – The reason they do that is because it gives them a credit line of phantom voters. In a nutshell this is how our elections are being stolen.
1:00 – Think about it. It would be a really stupid cheat to have an election happen and then afterwards you count the ballots and they don’t match the machine… That’s too easy. A recount is too easy of a thing to catch.
— So what they do instead is they bring a bunch of ballots and put them in. That way when the machines count the ballots they don’t have to cheat the machine.
— The machine’s job then is not to flip votes… even though we do have cases with that… The machine’s job is just simply to report progress.
— How are things going? Is it going as we predicted. If not, adjust it.
1:34 – And when you write a computer algorithm it does that kind of adjustment… It’s comparing to some target value. There’s a target value and then the computer is constantly checking saying “How is it going? Is it matching what we planned?” and then it’s constantly making adjustments.
— That’s why the machines are so important… And yes, absolutely the machines are connected to the internet.
— And then before the elections they also have to program the machines.
2:01 – And just to tease it again, I’ve been going around the country talking to people in different states and every once in a while I will come across a county clerk who says “Oh no Dr. Frank, we follow all the guidelines. Our elections are totally secure.”
— So I bring out the data. I show them the evidence. And they’re like “Oh, we were hacked huh?” Yup, you were. And then they’re not happy.
2:28 – And in several states now across the country people like that have said “Hey Dr. Frank, why don’t you bring your team in and let’s do a complete forensic audit of our machines.
— So you think that Maricopa is an audit? How would you like to do an audit where you have access to everything and nobody knows.
— We go in we take complete images of all the machines, of all the digital software that are in them, of all the routers, of everything.
— Before, during, and after the election. We record the activity during the election.
— All of that at the request of the county people. We have those.
3:13 – And so it’s always kind of comical to me when people say “Oh yea, but our machines are not connected to the internet. We have an air gap between our machines…” It’s like… your phone has an air gap between your phone and the internet. Yea, right, okay.
— It’s not real. Especially since we’re able to record the entire election through the internet during the election. Okay, we know they’re connected.
— So anyway. Get ready tonight.
3:45 – By the way, if someone knew that we had a complete recording of their election and it was going to expose a bunch of officials… What do you think might happen? Maybe we might have a few people that might want to come forward.
— Anyway so before the elections they program the machines. Yes?
4:09 – Then, during the election the databases continue to be hacked and tracked.
— We’ve got several situations where, during the actual election, we were downloading the registration databases from the county levels and keeping track…
— And it’s amazing. You can see them adding voters… removing voters. Adding voters who request ballots and received ballots even though nothing has happened.
— We’ve got records of all that happening in real time during the election.
— So that’s what’s happening during the election.
4:38 – And then after the election… You saw Patrick Colbeck sitting here. He’s been working in the state of MI for months and months on this.
— He has a term for this. He calls it The “eharmony dot com” phase…
— Because what happens is during the election they create all these voters… and then afterwards you have to put names onto them so that that way they can survive a subsequent audit.
— So he calls that the eharmony dot com.
5:02 – So you’ll notice that the whole point here is that throughout the entire election their computer algorithm is operating. Every county in our country is essentially hacked.
— Now the PCAPs (packet captures) and the electronic recordings we have show that they’re 3,009 so far.
— We haven’t even been been through all 37 terabytes. It’s just too huge of a job. It’s one of the reasons we’re having the symposium so we can bring in a bunch of cyber experts and they can help us.
— But we’ve got 3,009 of our counties already hacked. We’ve got evidence that they were hacked during the election.
5:35 – So there’s just no way that people are going to do that. It’s a computer algorithm that’s always operating that’s doing all that work.
5:45 – Don’t be afraid of that word algorithm. Algorithm is a word that we like to use in science because it’s just like a recipe. It’s a set of steps you do in order. But we like the word algorithm because that usually means there’s some equations mixed in… and some numbers mixed in.
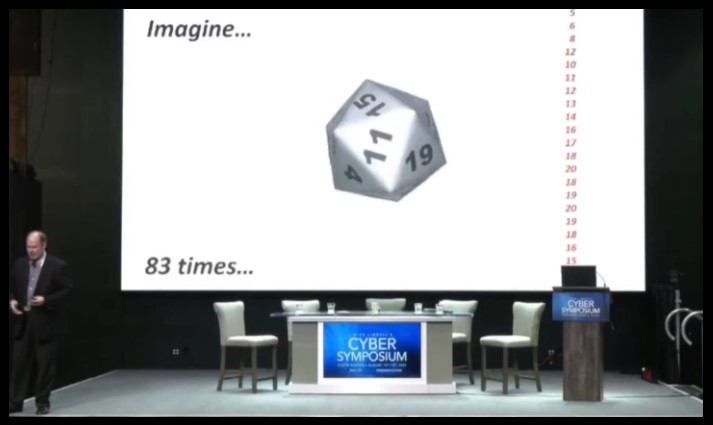
6:11 – Now, how would you know if an algorithm was operating?
— So here’s a simple way to know if an algorithm is operating.
— Pretend you have a 20 sided die and you roll it 83 times. And you get a series of numbers… and you write them down.
— And so then you go over to the next county over in your state and you roll it 83 times again. And you get the exact same 83 numbers in the same order.
— Is that normal? No. That ain’t natural buddy.
6:45 – And what happens is then you go to another county in your state and you get the same 83 numbers in the same order. You know that’s not real. You know there’s some kind of algorithm operating. Something is controlling what’s happening. That’s not natural.
— What if you go to every county in your state and they’re all the same? Then you know that’s not real. That’s how you can know. Now you don’t have to be a math genius, you just know… 83 times in a row? That’s just not right.
— There’s a reason for “83”. I’ll tell you later. (See 22:58.)
7:20 – Let’s say we’re here in the state of South Dakota. What if I step over the border into Nebraska?
— Let’s say we go into Nebraska and we start rolling the die… and as soon as we step over the border, instead of it being the same 83 numbers, it’s a new set of 83 numbers.
— But every county in Nebraska has the same set of 83 numbers.
7:50 – And then let’s say we step over the border and go into Iowa and we have a whole new set of 83 numbers, but it’s the same in every county.
— What you would know at that point is that the numbers are being decided for each state and that they’re being controlled in each county.
— That’s what’s happening in our election. The elections are being decided ahead of time by state and they’re controlled at the county.
8:23 – Okay so this is how I figured this out.
— So because I teach at this special school for really bright kids… genius kids… it’s pretty fun… I call it recess. I go there a couple hours in the mornings during the week.
8:39 – I like to teach my differential calculus class… I like to pick a real example from real life… Because I can teach them all the calculus they’re supposed to learn in that year… probably isn’t a semester.. So I stretch it out and I put in real life examples. And we actually apply the calculus as they’re learning it.
8:55 – Number of People of Each Age in USA, 2010 – 2017 (Chart)
— So this year in September I picked the United States Census. Why did I pick that? Well because all the talk is about the 2020 census.
— So how do you analyze data like this? So I was teaching them how to use calculus… planning to teach them on the 2020 census when it came out. But all I had was the 2010 census.
9:18 – So I was studying the 2010 census and I prepared this graph in September before the election. And it’s a good thing because I think if I hadn’t been doing that I wouldn’t have figured this out.
— And I think it’s a Divine appointment.
9:36 – So you’ll notice in the census what they do is that bat curve, the blue curve, that’s from 2010. That’s the 2010 census. And that’s the last detailed census of the whole country before the election.
— And then you’ll notice that what they do is each year the United States Census just shifts it one year. Only they don’t just only shift it, they attenuate it for mortality. Because 90 year olds don’t just become 100 year olds. Some of them die off.
— So that’s what the census does. These are data from them. This is not me doing anything. I’m just showing you what they provide.
10:10 – And I’d been studying this. So all this was fresh in my mind when Kathy Barnette asked me to go to PA and study her data because her election had been stolen.
— So this was all fresh in my mind.
10:23 – Pennsylvania, District 04 (chart)
— Okay, so let’s just talk about her district. Pennsylvania, District 04. One of the most corrupt in the country. Another Divine appointment.
— Notice what I’ve got across here is a graph. This is 0 to 100 years old. And then here is 0 to 12,000.
— How many people of each age are there? And you can notice, you can kind of see there’s some wiggles and bumps. Here are the Baby Boomers and then people pass away.
— But you notice, not everybody gets to vote. Right?
— Because you have to take out the 0 to 17 year olds and not everybody above 18 gets to vote. There’s about 4% of people you have to take out.
11:01 – So this is who’s registered… I mean this is who… an eligible voter in PA District 04. About 550,000 people.
— Well here’s who’s registered to vote in PA District 04. (Chart shows 97.9% registered.)
— And when I showed this to the board of elections people and the legislature in PA they all said “What? No, no, no, no, no that can’t be right. It should only be 60 or 70% of the people registered.”
— Yea. The election people themselves don’t know this has happened.
11:40 – So in other words, nearly everybody is registered and they didn’t even know it.
— And so that’s a warning flag… that they don’t even know.
— This is supposedly who voted in PA District 04.
— And whenever I show this to people they say “Dr. Frank, from about 50 years up those curves look really a lot alike. The red curve just looks a little smaller than the black curve. What’s up with that?” Yea. I agree. Something’s wrong with that.
12:11 – In fact if I multiply the black curve by 86%… You notice it superimposes right on the red curve pretty well. It’s surprisingly well so of course as a scientist I know something called the correlation coefficient, this “R” number. I’ll tell you about that in a little bit. And definitely that’s a warning flag that it’s so high.
12:38 – Let me tell you about correlation coefficient.
— So if a correlation coefficient is “1”, then that means it’s a perfect correlation. It means one set of data predicts another set of data perfectly.
— If the “R” is “0”, that means it’s completely random versus each other.
— If it’s “-1” it means one goes up, one goes down.
12:57 – So anytime you have a correlation coefficient near “1”, which this is, that’s not natural. It’s something that’s going on that’s making the two agree with each other.
— In medicine, in anything to deal with people… If you get correlation coefficients in the .7, .8 range, you’re doing amazingly well. Because anything to do with sociology or medicine, anything to do with people is usually really low.
— In physics, if you’re between .8 and .9, you’re doing amazingly.
— To get .99, that ain’t natural buddy.
13:31 – Alright so… this is PA District 04… except I’m showing you now the 2010 census. I’m about to compare it to PA District 04.
— But this is actually the 2010 census. What I did is I shrunk it though, so that it’s the same size as PA, District 04. It’s not millions of people. It’s thousands of people.
13:55 – Now notice when I shift it 10 years to the right… because it’s not 2010 anymore, it’s 2020… and I include the mortality just like the census does…
— Let me just go back so you can see me do that. I’m just going to shift it to the right and include a little mortality.
14:14 – See what I did? Because why would I want to do that? Well because it isn’t 2010 anymore. It’s 2020.
14:23 – So now when we add who’s registered in PA District 04…
— This was my first clue that they were using the census to inflate the registration rolls.
— Now if you think about that it totally makes sense.
— Let’s say you want to add a bunch of people to a county. You want to add a bunch of phony voters. Are you just going to add a million 60 year olds? No that would stick out like a sore thumb.
14:53 – You have to add a certain number of each age. Well how many do you add? What do you compare it to? The census. And you use the best census available, the 2010 census.
— You shift it 10 years. You attenuate it to the size of the county and you fill up to there.
15:11 – And if you do that, if you fill up to there… you’ll notice it’s going to take on the shape of the census.
— And a couple of the distinguishing features are these 2 peaks on the side and this peak here.
— You’ll see those in every county in the country in the registration database… Because they’re filling up to the census.
— So it’s like a fingerprint in every county. And I’ve done thousands of counties now across the country and it’s in every county. And you’ll notice that ain’t natural buddy.
15:45 – So now I’m just going to teach you a little math. I’m going to make up a pretend county and then I’m going to show you some real data.
— So this is the census. Back to the real census again. And you’ll notice that it basically is about 4 million people of every age and then people naturally remove themselves from the voter rolls. That’s a joke.
— I’ll try that again.
16:10 – So you’ll notice there are about 4 million of every age and then people naturally remove themselves from the voter rolls.
16:20 – So here’s my pretend county. And you’ll notice I’ve given 15 people of every age until they’re about 60 and then they naturally remove themselves from the voter rolls.
— That’s a pretend county and it has 1,275 people in it. And the reason I picked that number is because if you take out the kids (17 and below), you end up with exactly a 1,000 people in my imaginary county. Eligible voters (18+, 1000)
— And my supermoms are always saying “Dr. Frank, you’ve got to make the math easy.”
16:50 – We have 1,000 people in our imaginary county. And you’ll notice about 15 people of every age and then they die.
— Now a certain percentage of those are going to be registered to vote. And I just picked this number, 13/15ths, or 87% because it fits with some other data.
17:11 – But I’ll tell you the story. When I first was developing these slides I have a dear friend who was my roommate in college who worked for Newt Gingrich for 30 years.
— I was practicing on him and showing him these slides. And he said “Oh Dr. Frank, that’s a really bad example.” “Why is that Mark?” He says “Well, there’s no way a county has 87% registration.”
— I’ve already shown you much more than that huh? So in other words, a guy who’s a political expert and he’s been doing it for 30 years thinks this is ridiculous. But boy did he have something to learn didn’t he?
17:44 – Okay. And then a certain percentage of those that are registered will vote.
— If I assume that’s 70%… Then you’ll notice you’ve got your population here; and then you have who is registered to vote; and then who actually voted. Make sense?
18:01 – By the way, if you know the blue curve (population) and you know the percentage (% registered to vote), you can get the black curve (# registered to vote).
— If you know the black curve (# registered to vote) and you know the percentage (% registered to vote), you can get the red curve (# ballots / actual votes).
— If you know any of the curves and you know the percentages (% registered to vote), you can get any of the other curves.
18:22 – That’s how I was able to leave PA with a set of algorithms in my hand, not knowing anyone who was registered in the state of OH… and I predicted every county in the state of OH before I even knew.
— And Mike was talking about that because I was bragging how great OH was right? “Oh, yea we got to figure it out in OH… we have secure elections.” Nope. I was able to predict them all. Then I realized, nope, this is everywhere.
18:50 – And I have to admit, you know, as a scientist you’re supposed to be skeptical of yourself. And I was. I could predict all these counties in PA.
— And so the state legislators, they said to me “Well, Dr. Frank have you tried any other states?” And I said “Well, no. I’ve been assuming all the corruption is here in PA.”
— And they said “Why don’t you try another state where you think there isn’t any corruption?”
— “Okay, I’ll do OH.” And then I was able to predict all of them.
— I tried FL. Nope. 14 counties then in FL. Oops.
— NC. Oops.
— CO. Oops. Everywhere I was going.
— And so I was starting to doubt myself a little bit. Like wait a minute. Is there something else going on here that I’m not thinking about because how can I go around predicting this everywhere, especially in states that I think Trump won? … You would think there is no manipulation here.
19:47 – Then I meet Mike Lindell and he talks about his electronic evidence and the fact that at the time he had 2,800 counties worth of incursion data.
— Oh. Now I understand. There are computer algorithms operating in every county in the country. No wonder I can predict it everywhere.
20:06 – Alright. Now here’s a real county. This is Hamilton County, OH. This is right near me. This is Cincinnati. It’s a big county. So these are real data now. Not makeup data.
— You’ll notice we have age across bottom again… And how many thousands of people of each age. You can see the Millennials and the Baby Boomers nice and clearly.
— This is OH now not PA.
20:28 – Here’s who’s registered to vote in Hamilton County, OH.
— Oops. When I showed this to the board of elections director in Cincinnati she was shocked.
— She’s like “How did that happen?” Exactly.
— Do you know why these people don’t know this has happened to them? Because these are big data sets. These are hard to work with.
20:53 – And what’s happened is the election companies give them software that allow them to work with their databases. The software that they’re given doesn’t do this. The software that they’re given just gives them totals and lists.
— And so they’re not used to even being able to do this.
— It takes a data geek. It takes a scientist. It takes someone that likes graphing and exploring data to begin to do this. So just showing them this is a shock.
21:17 – By the way, just while we’re here… You see these 2 peaks on the side… that’s the census isn’t it. It’s the breadcrumbs of the census peaking its way in.
21:27 – Alright, so that’s supposedly who’s registered. That’s a warning flag (#1).
21:32 – By the way, I’m not the only person to figure this out.
— In October, Judicial Watch published an article before the election showing that 353 of our counties in the United States, in 29 states, had voter registration more than the population.
— Why did we let this happen? We were being told that our election was being hacked. We all didn’t listen. We didn’t understand.
22:07 – So back to Cincinnati..
— Here’s who supposedly voted in Cincinnati. Do you notice a pattern? Just like in PA from about 50 years off. It’s about a perfect match.
— Let’s just compare that to make that easy for you to see.
22:22 – And if we give that number… I just chose the same number there that I did in PA, 86%… If we call that number the Registration Key…
— Think of it like a code. You’ve got one set of data and you have a key to break that code that allows you to convert this set of data to this set of data.
— And so that number would be 86%. That’s like a key. How do you convert this to this. You use that key.
22:48 – And the fact that that repeats… the same thing that happened… in a different state. This is OH now. The first thing I showed you was PA. (Warning flag #2.)
22:58 – But we wouldn’t have to have only one number. We wouldn’t have to have just 86%.
— We could have a percent for every 18 year old, a percent for every 19 year old, a percent for every 20 year old. We could have a different percent for every age. That would be 83 numbers.
— You’ve heard 83 before. 83 numbers… 18, 19, 20, 21, 22, all the way up to 100. You’ve got 83 numbers.
23:22 – So let’s say we had 83 numbers… And we could call that the key instead of just one number. It’s a collection of 83 numbers. (You need a different proportion for every age. Together they define the “Registration Key”.)
— And if we do that this is what you get.
— The black curve (predicted ballots) is what I would predict you would get.
— The red curve (ballots) is what we actually observed.
23:40 – And when I show this to people, they wisely noticed “Well, hey Dr. Frank, if you can just get 83 numbers you should be able to make it fit perfectly. How come it doesn’t quite fit perfectly?”
— Well the answer is because I didn’t use Hamilton County to get my percentages. I used Franklin County. And I used those percentages for every county in the state of OH. And it’s the same in every county.
24:07 – And this is what those 83 numbers look like. From 18 up to 100… 83 numbers. 83 percentages.
— And when I show this to people they’re like “Wait a minute. That’s a smooth curve. You mean the percentages from 18 to 100 vary smoothly?”
— Yes. In fact that’s called a 6th order polynomial.
24:30 – We scientists like polynomials to describe things. And what’s so fun about that is if I had put these data into Excel, which I did… I made this graph in Excel… And I right click on it and I say “Add a trend line.” Then it will say “Well what kind of line would you like to put in? Would you like it to be a 2nd order polynomial, or a 3rd order polynomial?”
— And you start adding. This little scroll button… You click on it… 4th order, 5th order, 6th order.
24:59 – When you hit 6th order it won’t go any higher. It’s stuck there. Because 6th order is as high as Excel goes.
— And guess what… Every state in our country I can predict this way with a 6th order polynomial.
25:10 – In other words … America was stolen by an Excel spreadsheet.
25:20 – Okay. So lets go back to this again.
— So you notice, once I know the percentages … If I know one thing I can get all the others. Yea?
— So all I have to do is go into any state, look at one county, and I can predict all the others… Because every state has its own key.
25:40 – Just like in the state with rolling the die 83 times. It works in every county in that state. But when you go into a new state it’s a new set of 83 numbers. So every state has its own key. Make sense?
25:54 – Okay. So, I had to pick a state so I just picked OH. Just to kind of let you see.
— Now, what I’m going to do in this set of 88 slides… They’re going to go by really fast. It takes 1 minute to play.
— What you want to look at is you can look at the “R” factors… How good it’s correlating…
— Or you can look at these bottom two graphs (predicted ballots & ballots)
— Or you can look at the black curve. (registrations)
25:16 – Let’s just review what they are:
— The blue curve is the population of a county.
— The black curve is who’s registered in that county.
— The red curve is who’s supposedly voted in that county.
— And the blue curve underneath is my prediction.
26:31 – Now what’s fun about these set of data is I’m going to make the prediction two different ways:
— I’m going to make the prediction based upon the population. Pretend I don’t even know who’s registered. I’m just going to make a prediction based upon the population.
— And then I’m going to make a second prediction if I did know who was registered.
26:49 – So I’m going to show you two graphs for every county. And they’re going to play… boom, boom, boom, boom… It takes about a minute to play or something like that.
— And what you’re going to be looking for is these bottom two graphs.
— And you’re going to notice that the population prediction isn’t quite as good as the registration prediction.
— But it makes sense. Because if I have to start from here to get to here I have to go through two numbers. So it’s harder to predict.
— I can go straight from there to there. That’s one way of predicting. Or I can go from the black to the red.
— So I’m going to predict them both ways for you.
27:22 – Prediction video. (88 slides)
— So this is all of them. And I know it’s a lot. But I just want you to see that every county is predictable two ways.
— Now I have been doing this across the country. And what I like to do is I like to get the data for a particular state; and do all the analyses; and then we release it in the state and people get all freaked out. And they say “Hey, we got a problem.” Yea, you got a problem.
27:55 – And then I’ll come out there and I’ll meet the supermoms and we have a few events. I meet with a few key legislators. We plan our event.
— A couple weeks later there’s a big event. The public is all worked up about it and we have a movement going.
28:11 – Right now I’ve done that in 13 states in person and I’m working with 30 total states. Our supermoms are kicking butt I tell ya.
28:33 – (Colored map of the U.S.)
— Alright, so here’s the thing. I’ve explained this to you. Now this is really just a top level analysis. I’ve got all kinds of other analyses that go down… In fact, I’ve got analyses that will take you right down to the precinct level and you can knock on doors and find phantom voters.
-But this just gives you the overall view so you kind of know what’s happened.
29:09 – (Responds to a question.) That isn’t what these predictions are. Keep in mind, to predict them I have to be able to get in the minds of the people who decided ahead of time what they wanted the outcomes.
— It’s not as easy as you think because sometimes the people getting elected are… you wonder, why would they elect that… you know… That’s a whole other discussion. Which we need to have that discussion.
29:35 – Okay, so I’ve just explained to you how our elections are being stolen. Now how do you explain this to your friends.
— It’s hard without the graphs.
— So I told you about rolling a die 83 times.
— Here’s another way to explain it to your friends and I developed this metaphor with my supermoms.
29:50 – Blonde Hair Analogy
— Let’s say you’re in the state of OH. Imagine you’re in the state of OH. Easy to do for the ladies in my state.
— And let’s say the 2020 census just came out. And you look at it and it says that 10.0% of the people in your county have blonde hair.
— And then you go to the next county over and you look at the 2020 census and it says 10.0% of the people there have blonde hair.
30:33 – And that’s a little puzzling because you’re Amish and they’re Mexican. You know as a county it’s kind of strange that they would be exactly the same percentages.
— But you keep looking around the state and every single county has 10.0% blonde hair.
— That just doesn’t make sense does it. You would think something is wrong with that.
30:52 – So you look at the next state over. You look at PA. And 13.4% of the people there in the very first county have blonde hair.
— Now wait a minute. Everybody in OH was 10.0%, but now suddenly it’s different?
— And every county in PA is 13.4%?
31:10 – So you go to FL and now every county there is the same but different than the previous. You know something is wrong with this don’t you.
— You go over to CO and it’s a new percentage, but every county has the exact same percentage of blonde hair.
31:23 – You know that can’t be right. You know that it’s being decided at a state level and controlled at the county level. So that’s a way to explain that.
31:33 – But it’s worse than that really. Because you remember that 10.0%?
— Imagine if that was just for 18 year olds. What if you have a different percentage for 19 year olds; and a different percentage for 20 year olds; and a different percentage for each age all the way up to 100.
31:51 – And they were all the same in every county and state.
— And it didn’t matter whether you were in a large county, small county, urban county, rural county, black county, white county, green county, doesn’t matter…
— The same percentages in every one. You know that isn’t real. That’s not natural.
— So that’s a simple way for you to explain to your friends. Just use the blonde hair analogy.
32:14 – Now the reason I’m going around the country is cause I’m a firm believer in the people. If they’re given the truth, they can be depended upon to meet any national crisis.
— Is this a national crisis? Yea, I think we just lost our country.
— Mr. Lindell in the movie Scientific Proof… We did that together… About 15 minutes in he said “It’s a good thing that we lost the election or we wouldn’t know we lost our country.”
— I wouldn’t have even have looked at this. That’s another Divine appointment.
32:42 – The great point is to bring them the real facts. And bringing them the real facts is what I’m trying to do and what Mr. Lindell is doing.
— Now the problem is I learned the bitter lesson that legislatures aren’t going to save us.
— I learned the bitter lesson that our legal system isn’t going to save us.
— No one is coming to save us. We are the people we are waiting for.
33:10 – And if I’ve learned anything from last year, politicians don’t start parades they join them. So you have to be the parade.
— And it’s not that the politicians are evil, its they need you. They’re good politicians who need you to start the parade and need you to be in the parade… need to build the parade so that they can accomplish their legislative agenda.
33:36 – I’ve seen several politicians here this week and they’re going to be heroes, but we need to equip them and we need to start the parade for them.
-So that’s what I’m doing. I’m going around starting parades.
33:47 – So I’m a physicist, so I like to use metaphors. So let’s pretend that this piece of aluminum… just a piece of aluminum. This is United States… this piece of aluminum.
— And here is me spreading the truth. That’s not the microphone working, that’s really annoying like that. And I can make that really loud and really annoying. It’s kind of annoying. And it’s all pervasive.
34:21 – So this is America. This is the truth resonating in America. We just have to make it really annoying. We just have to make it unbearable. We just have to keep getting louder and not let them silence us.
— So that’s it.
…Doug should also include Pearson’s probability: Probability that curves are NOT functionally dependent (NULL HYPOTHESIS)…a very accessible online calculation…https://www.socscistatistics.com/tests/pearson/default2.aspx ;
…as a missile defense physicist for USAF Research Lab…this is a very rapid statistical/probability method of assessing curve functional relationship [[email protected]]
…and after looking over Dr. Frank’s method I would note: 1. He has plotted data for MULTIPLE counties and states; 2. Each of the counties plotted for population as functions of age distribution… are (according to his census data)…THE SAME; 3. Counties having variant percentages of age groups (some counties have…ie…having MORE elderly in county… and LESS elderly in another county…is rare in his data; 4. THAT ALL US COUNTIES HAVING ALL AGE POPULATIONS EXCEEDING CORRELATION COEFFICIENT (r: .9) IS STATISTICALLY ABSURD. Dr. Frank is correct when he asserts that age population densities should CHANGE within counties and states (retirement counties and states). THE DATA STATES FRAUDULENTLY: Constant age populations (per age group) in all (MULTIPLE) US counties….ABSURD!!! Conclusion: Dr. Franks is CORRECT.
Thank you SD for posting this segment – I did my best to watch as much Cyber Symposium as possible but I had missed Dr. Frank’s presentation.
.
Well first Yes, I “believe” the election was stolen based solely on election totals. Does anyone truly believe that Biden got more votes than Obama and Hillary? I don’t, and history shows that result is highly improbable. Believe is that pesky preliminary term in formal logic. Like in I believe it but I don’t know it and I can’t prove it.
This from someone that was actually hired as an analyst to look into a mayoral election. And I forced a recount.
Making this short, All election computers, this means all of them, including the ballot readers MUST have NO other software other than what has been approved by state election laws – period.
In my case I found an “illegal” database program in the aggregating computer. This because reports were printed during election night and when I analyzed those, and found that there was no other way those printouts could happen. Sure enough I found the program. My first time on the 6 PM local news, which my wife recorded :).
And by the way the program was installed by a lowly programmer, wanting to verify the accuracy of the tallies, so the outcome of the election did not change. Still illegal though….
So, all this said, I KNOW what it takes to find wrongdoing in elections. And I’m sorry to say that even though I believe it indeed happened, so far I have not seen any definitive proof of that.
Makes me wonder if today’s so called analysts are up to the task…..
Wow. Stunning. This needs to be viewed by the American public.
The fraud began with voter registration, there is no way 97% of the population is registered to vote in District 04 of Pennsylvania, as well hundreds of counties over 80%. We need a nationwide voter registration purge to get back to correct voter registration numbers, where 1 real person = 1 registered voter. If we fix the voter registration problem, virtually ALL of the fraud goes away.
“Participation in voting is more than just a value. It is the foundational virtue of our democracy.”
No one disagrees that the right to vote is the foundation of our Country. This is what politicians and the media have brought to our attention. This is so important that the All-Star game had to be moved from Georgia. So, if this right is that important, you would think that the accuracy of your vote should have equal value. Is there a reason why our Press and other forms of Media have become defiant with anyone that hints of election fraud?