Dr. Douglas G. Frank explains information he discovered as he reviewed election outcomes. Dr. Frank found the baseline for the 2020 vote was created by applying an algorithm that used the 2010 census to fabricate the illusion of registered voters at a state level (predetermined), and then results are controlled at a county level.
Transcript courtesy of Stillwater:
0:01 – So here’s how our elections are being stolen. In a nutshell, this is how our elections are being stolen.
— Someone before the election decides what they want the outcome to be. It’s a decision ahead of time.
— And then they make projections and they say “Well, we think this is what’s going to happen…”
— So they want to regulate that at a county level to make sure they get the outcome they want. So what they do is they inflate the registration databases.
0:30 – Now this is before the election, and during the election, and after the election they’re manipulating the database. But beforehand they make an estimate of what they think is going to happen and they inflate the registration databases.
— So the beginning big hack… most of the hack of the election… takes place at this point beforehand. They inflate the registration databases.
0:51 – The reason they do that is because it gives them a credit line of phantom voters. In a nutshell this is how our elections are being stolen.
1:00 – Think about it. It would be a really stupid cheat to have an election happen and then afterwards you count the ballots and they don’t match the machine… That’s too easy. A recount is too easy of a thing to catch.
— So what they do instead is they bring a bunch of ballots and put them in. That way when the machines count the ballots they don’t have to cheat the machine.
— The machine’s job then is not to flip votes… even though we do have cases with that… The machine’s job is just simply to report progress.
— How are things going? Is it going as we predicted. If not, adjust it.
1:34 – And when you write a computer algorithm it does that kind of adjustment… It’s comparing to some target value. There’s a target value and then the computer is constantly checking saying “How is it going? Is it matching what we planned?” and then it’s constantly making adjustments.
— That’s why the machines are so important… And yes, absolutely the machines are connected to the internet.
— And then before the elections they also have to program the machines.
2:01 – And just to tease it again, I’ve been going around the country talking to people in different states and every once in a while I will come across a county clerk who says “Oh no Dr. Frank, we follow all the guidelines. Our elections are totally secure.”
— So I bring out the data. I show them the evidence. And they’re like “Oh, we were hacked huh?” Yup, you were. And then they’re not happy.
2:28 – And in several states now across the country people like that have said “Hey Dr. Frank, why don’t you bring your team in and let’s do a complete forensic audit of our machines.
— So you think that Maricopa is an audit? How would you like to do an audit where you have access to everything and nobody knows.
— We go in we take complete images of all the machines, of all the digital software that are in them, of all the routers, of everything.
— Before, during, and after the election. We record the activity during the election.
— All of that at the request of the county people. We have those.
3:13 – And so it’s always kind of comical to me when people say “Oh yea, but our machines are not connected to the internet. We have an air gap between our machines…” It’s like… your phone has an air gap between your phone and the internet. Yea, right, okay.
— It’s not real. Especially since we’re able to record the entire election through the internet during the election. Okay, we know they’re connected.
— So anyway. Get ready tonight.
3:45 – By the way, if someone knew that we had a complete recording of their election and it was going to expose a bunch of officials… What do you think might happen? Maybe we might have a few people that might want to come forward.
— Anyway so before the elections they program the machines. Yes?
4:09 – Then, during the election the databases continue to be hacked and tracked.
— We’ve got several situations where, during the actual election, we were downloading the registration databases from the county levels and keeping track…
— And it’s amazing. You can see them adding voters… removing voters. Adding voters who request ballots and received ballots even though nothing has happened.
— We’ve got records of all that happening in real time during the election.
— So that’s what’s happening during the election.
4:38 – And then after the election… You saw Patrick Colbeck sitting here. He’s been working in the state of MI for months and months on this.
— He has a term for this. He calls it The “eharmony dot com” phase…
— Because what happens is during the election they create all these voters… and then afterwards you have to put names onto them so that that way they can survive a subsequent audit.
— So he calls that the eharmony dot com.
5:02 – So you’ll notice that the whole point here is that throughout the entire election their computer algorithm is operating. Every county in our country is essentially hacked.
— Now the PCAPs (packet captures) and the electronic recordings we have show that they’re 3,009 so far.
— We haven’t even been been through all 37 terabytes. It’s just too huge of a job. It’s one of the reasons we’re having the symposium so we can bring in a bunch of cyber experts and they can help us.
— But we’ve got 3,009 of our counties already hacked. We’ve got evidence that they were hacked during the election.
5:35 – So there’s just no way that people are going to do that. It’s a computer algorithm that’s always operating that’s doing all that work.
5:45 – Don’t be afraid of that word algorithm. Algorithm is a word that we like to use in science because it’s just like a recipe. It’s a set of steps you do in order. But we like the word algorithm because that usually means there’s some equations mixed in… and some numbers mixed in.
6:11 – Now, how would you know if an algorithm was operating?
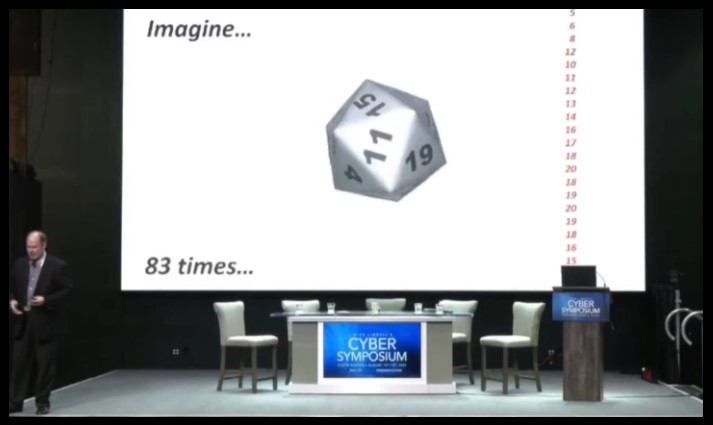
— So here’s a simple way to know if an algorithm is operating.
— Pretend you have a 20 sided die and you roll it 83 times. And you get a series of numbers… and you write them down.
— And so then you go over to the next county over in your state and you roll it 83 times again. And you get the exact same 83 numbers in the same order.
— Is that normal? No. That ain’t natural buddy.
6:45 – And what happens is then you go to another county in your state and you get the same 83 numbers in the same order. You know that’s not real. You know there’s some kind of algorithm operating. Something is controlling what’s happening. That’s not natural.
— What if you go to every county in your state and they’re all the same? Then you know that’s not real. That’s how you can know. Now you don’t have to be a math genius, you just know… 83 times in a row? That’s just not right.
— There’s a reason for “83”. I’ll tell you later. (See 22:58.)
7:20 – Let’s say we’re here in the state of South Dakota. What if I step over the border into Nebraska?
— Let’s say we go into Nebraska and we start rolling the die… and as soon as we step over the border, instead of it being the same 83 numbers, it’s a new set of 83 numbers.
— But every county in Nebraska has the same set of 83 numbers.
7:50 – And then let’s say we step over the border and go into Iowa and we have a whole new set of 83 numbers, but it’s the same in every county.
— What you would know at that point is that the numbers are being decided for each state and that they’re being controlled in each county.
— That’s what’s happening in our election. The elections are being decided ahead of time by state and they’re controlled at the county.
8:23 – Okay so this is how I figured this out.
— So because I teach at this special school for really bright kids… genius kids… it’s pretty fun… I call it recess. I go there a couple hours in the mornings during the week.
8:39 – I like to teach my differential calculus class… I like to pick a real example from real life… Because I can teach them all the calculus they’re supposed to learn in that year… probably isn’t a semester.. So I stretch it out and I put in real life examples. And we actually apply the calculus as they’re learning it.
8:55 – Number of People of Each Age in USA, 2010 – 2017 (Chart)
— So this year in September I picked the United States Census. Why did I pick that? Well because all the talk is about the 2020 census.
— So how do you analyze data like this? So I was teaching them how to use calculus… planning to teach them on the 2020 census when it came out. But all I had was the 2010 census.
9:18 – So I was studying the 2010 census and I prepared this graph in September before the election. And it’s a good thing because I think if I hadn’t been doing that I wouldn’t have figured this out.
— And I think it’s a Divine appointment.
9:36 – So you’ll notice in the census what they do is that bat curve, the blue curve, that’s from 2010. That’s the 2010 census. And that’s the last detailed census of the whole country before the election.
— And then you’ll notice that what they do is each year the United States Census just shifts it one year. Only they don’t just only shift it, they attenuate it for mortality. Because 90 year olds don’t just become 100 year olds. Some of them die off.
— So that’s what the census does. These are data from them. This is not me doing anything. I’m just showing you what they provide.
10:10 – And I’d been studying this. So all this was fresh in my mind when Kathy Barnette asked me to go to PA and study her data because her election had been stolen.
— So this was all fresh in my mind.
10:23 – Pennsylvania, District 04 (chart)
— Okay, so let’s just talk about her district. Pennsylvania, District 04. One of the most corrupt in the country. Another Divine appointment.
— Notice what I’ve got across here is a graph. This is 0 to 100 years old. And then here is 0 to 12,000.
— How many people of each age are there? And you can notice, you can kind of see there’s some wiggles and bumps. Here are the Baby Boomers and then people pass away.
— But you notice, not everybody gets to vote. Right?
— Because you have to take out the 0 to 17 year olds and not everybody above 18 gets to vote. There’s about 4% of people you have to take out.
11:01 – So this is who’s registered… I mean this is who… an eligible voter in PA District 04. About 550,000 people.
— Well here’s who’s registered to vote in PA District 04. (Chart shows 97.9% registered.)
— And when I showed this to the board of elections people and the legislature in PA they all said “What? No, no, no, no, no that can’t be right. It should only be 60 or 70% of the people registered.”
— Yea. The election people themselves don’t know this has happened.
11:40 – So in other words, nearly everybody is registered and they didn’t even know it.
— And so that’s a warning flag… that they don’t even know.
— This is supposedly who voted in PA District 04.
— And whenever I show this to people they say “Dr. Frank, from about 50 years up those curves look really a lot alike. The red curve just looks a little smaller than the black curve. What’s up with that?” Yea. I agree. Something’s wrong with that.
12:11 – In fact if I multiply the black curve by 86%… You notice it superimposes right on the red curve pretty well. It’s surprisingly well so of course as a scientist I know something called the correlation coefficient, this “R” number. I’ll tell you about that in a little bit. And definitely that’s a warning flag that it’s so high.
12:38 – Let me tell you about correlation coefficient.
— So if a correlation coefficient is “1”, then that means it’s a perfect correlation. It means one set of data predicts another set of data perfectly.
— If the “R” is “0”, that means it’s completely random versus each other.
— If it’s “-1” it means one goes up, one goes down.
12:57 – So anytime you have a correlation coefficient near “1”, which this is, that’s not natural. It’s something that’s going on that’s making the two agree with each other.
— In medicine, in anything to deal with people… If you get correlation coefficients in the .7, .8 range, you’re doing amazingly well. Because anything to do with sociology or medicine, anything to do with people is usually really low.
— In physics, if you’re between .8 and .9, you’re doing amazingly.
— To get .99, that ain’t natural buddy.
13:31 – Alright so… this is PA District 04… except I’m showing you now the 2010 census. I’m about to compare it to PA District 04.
— But this is actually the 2010 census. What I did is I shrunk it though, so that it’s the same size as PA, District 04. It’s not millions of people. It’s thousands of people.
13:55 – Now notice when I shift it 10 years to the right… because it’s not 2010 anymore, it’s 2020… and I include the mortality just like the census does…
— Let me just go back so you can see me do that. I’m just going to shift it to the right and include a little mortality.
14:14 – See what I did? Because why would I want to do that? Well because it isn’t 2010 anymore. It’s 2020.
14:23 – So now when we add who’s registered in PA District 04…
— This was my first clue that they were using the census to inflate the registration rolls.
— Now if you think about that it totally makes sense.
— Let’s say you want to add a bunch of people to a county. You want to add a bunch of phony voters. Are you just going to add a million 60 year olds? No that would stick out like a sore thumb.
14:53 – You have to add a certain number of each age. Well how many do you add? What do you compare it to? The census. And you use the best census available, the 2010 census.
— You shift it 10 years. You attenuate it to the size of the county and you fill up to there.
15:11 – And if you do that, if you fill up to there… you’ll notice it’s going to take on the shape of the census.
— And a couple of the distinguishing features are these 2 peaks on the side and this peak here.
— You’ll see those in every county in the country in the registration database… Because they’re filling up to the census.
— So it’s like a fingerprint in every county. And I’ve done thousands of counties now across the country and it’s in every county. And you’ll notice that ain’t natural buddy.
15:45 – So now I’m just going to teach you a little math. I’m going to make up a pretend county and then I’m going to show you some real data.
— So this is the census. Back to the real census again. And you’ll notice that it basically is about 4 million people of every age and then people naturally remove themselves from the voter rolls. That’s a joke.
— I’ll try that again.
16:10 – So you’ll notice there are about 4 million of every age and then people naturally remove themselves from the voter rolls.
16:20 – So here’s my pretend county. And you’ll notice I’ve given 15 people of every age until they’re about 60 and then they naturally remove themselves from the voter rolls.
— That’s a pretend county and it has 1,275 people in it. And the reason I picked that number is because if you take out the kids (17 and below), you end up with exactly a 1,000 people in my imaginary county. Eligible voters (18+, 1000)
— And my supermoms are always saying “Dr. Frank, you’ve got to make the math easy.”
16:50 – We have 1,000 people in our imaginary county. And you’ll notice about 15 people of every age and then they die.
— Now a certain percentage of those are going to be registered to vote. And I just picked this number, 13/15ths, or 87% because it fits with some other data.
17:11 – But I’ll tell you the story. When I first was developing these slides I have a dear friend who was my roommate in college who worked for Newt Gingrich for 30 years.
— I was practicing on him and showing him these slides. And he said “Oh Dr. Frank, that’s a really bad example.” “Why is that Mark?” He says “Well, there’s no way a county has 87% registration.”
— I’ve already shown you much more than that huh? So in other words, a guy who’s a political expert and he’s been doing it for 30 years thinks this is ridiculous. But boy did he have something to learn didn’t he?
17:44 – Okay. And then a certain percentage of those that are registered will vote.
— If I assume that’s 70%… Then you’ll notice you’ve got your population here; and then you have who is registered to vote; and then who actually voted. Make sense?
18:01 – By the way, if you know the blue curve (population) and you know the percentage (% registered to vote), you can get the black curve (# registered to vote).
— If you know the black curve (# registered to vote) and you know the percentage (% registered to vote), you can get the red curve (# ballots / actual votes).
— If you know any of the curves and you know the percentages (% registered to vote), you can get any of the other curves.
18:22 – That’s how I was able to leave PA with a set of algorithms in my hand, not knowing anyone who was registered in the state of OH… and I predicted every county in the state of OH before I even knew.
— And Mike was talking about that because I was bragging how great OH was right? “Oh, yea we got to figure it out in OH… we have secure elections.” Nope. I was able to predict them all. Then I realized, nope, this is everywhere.
18:50 – And I have to admit, you know, as a scientist you’re supposed to be skeptical of yourself. And I was. I could predict all these counties in PA.
— And so the state legislators, they said to me “Well, Dr. Frank have you tried any other states?” And I said “Well, no. I’ve been assuming all the corruption is here in PA.”
— And they said “Why don’t you try another state where you think there isn’t any corruption?”
— “Okay, I’ll do OH.” And then I was able to predict all of them.
— I tried FL. Nope. 14 counties then in FL. Oops.
— NC. Oops.
— CO. Oops. Everywhere I was going.
— And so I was starting to doubt myself a little bit. Like wait a minute. Is there something else going on here that I’m not thinking about because how can I go around predicting this everywhere, especially in states that I think Trump won? … You would think there is no manipulation here.
19:47 – Then I meet Mike Lindell and he talks about his electronic evidence and the fact that at the time he had 2,800 counties worth of incursion data.
— Oh. Now I understand. There are computer algorithms operating in every county in the country. No wonder I can predict it everywhere.
20:06 – Alright. Now here’s a real county. This is Hamilton County, OH. This is right near me. This is Cincinnati. It’s a big county. So these are real data now. Not makeup data.
— You’ll notice we have age across bottom again… And how many thousands of people of each age. You can see the Millennials and the Baby Boomers nice and clearly.
— This is OH now not PA.
20:28 – Here’s who’s registered to vote in Hamilton County, OH.
— Oops. When I showed this to the board of elections director in Cincinnati she was shocked.
— She’s like “How did that happen?” Exactly.
— Do you know why these people don’t know this has happened to them? Because these are big data sets. These are hard to work with.
20:53 – And what’s happened is the election companies give them software that allow them to work with their databases. The software that they’re given doesn’t do this. The software that they’re given just gives them totals and lists.
— And so they’re not used to even being able to do this.
— It takes a data geek. It takes a scientist. It takes someone that likes graphing and exploring data to begin to do this. So just showing them this is a shock.
21:17 – By the way, just while we’re here… You see these 2 peaks on the side… that’s the census isn’t it. It’s the breadcrumbs of the census peaking its way in.
21:27 – Alright, so that’s supposedly who’s registered. That’s a warning flag (#1).
21:32 – By the way, I’m not the only person to figure this out.
— In October, Judicial Watch published an article before the election showing that 353 of our counties in the United States, in 29 states, had voter registration more than the population.
— Why did we let this happen? We were being told that our election was being hacked. We all didn’t listen. We didn’t understand.
22:07 – So back to Cincinnati..
— Here’s who supposedly voted in Cincinnati. Do you notice a pattern? Just like in PA from about 50 years off. It’s about a perfect match.
— Let’s just compare that to make that easy for you to see.
22:22 – And if we give that number… I just chose the same number there that I did in PA, 86%… If we call that number the Registration Key…
— Think of it like a code. You’ve got one set of data and you have a key to break that code that allows you to convert this set of data to this set of data.
— And so that number would be 86%. That’s like a key. How do you convert this to this. You use that key.
22:48 – And the fact that that repeats… the same thing that happened… in a different state. This is OH now. The first thing I showed you was PA. (Warning flag #2.)
22:58 – But we wouldn’t have to have only one number. We wouldn’t have to have just 86%.
— We could have a percent for every 18 year old, a percent for every 19 year old, a percent for every 20 year old. We could have a different percent for every age. That would be 83 numbers.
— You’ve heard 83 before. 83 numbers… 18, 19, 20, 21, 22, all the way up to 100. You’ve got 83 numbers.
23:22 – So let’s say we had 83 numbers… And we could call that the key instead of just one number. It’s a collection of 83 numbers. (You need a different proportion for every age. Together they define the “Registration Key”.)
— And if we do that this is what you get.
— The black curve (predicted ballots) is what I would predict you would get.
— The red curve (ballots) is what we actually observed.
23:40 – And when I show this to people, they wisely noticed “Well, hey Dr. Frank, if you can just get 83 numbers you should be able to make it fit perfectly. How come it doesn’t quite fit perfectly?”
— Well the answer is because I didn’t use Hamilton County to get my percentages. I used Franklin County. And I used those percentages for every county in the state of OH. And it’s the same in every county.
24:07 – And this is what those 83 numbers look like. From 18 up to 100… 83 numbers. 83 percentages.
— And when I show this to people they’re like “Wait a minute. That’s a smooth curve. You mean the percentages from 18 to 100 vary smoothly?”
— Yes. In fact that’s called a 6th order polynomial.
24:30 – We scientists like polynomials to describe things. And what’s so fun about that is if I had put these data into Excel, which I did… I made this graph in Excel… And I right click on it and I say “Add a trend line.” Then it will say “Well what kind of line would you like to put in? Would you like it to be a 2nd order polynomial, or a 3rd order polynomial?”
— And you start adding. This little scroll button… You click on it… 4th order, 5th order, 6th order.
24:59 – When you hit 6th order it won’t go any higher. It’s stuck there. Because 6th order is as high as Excel goes.
— And guess what… Every state in our country I can predict this way with a 6th order polynomial.
25:10 – In other words … America was stolen by an Excel spreadsheet.
25:20 – Okay. So lets go back to this again.
— So you notice, once I know the percentages … If I know one thing I can get all the others. Yea?
— So all I have to do is go into any state, look at one county, and I can predict all the others… Because every state has its own key.
25:40 – Just like in the state with rolling the die 83 times. It works in every county in that state. But when you go into a new state it’s a new set of 83 numbers. So every state has its own key. Make sense?
25:54 – Okay. So, I had to pick a state so I just picked OH. Just to kind of let you see.
— Now, what I’m going to do in this set of 88 slides… They’re going to go by really fast. It takes 1 minute to play.
— What you want to look at is you can look at the “R” factors… How good it’s correlating…
— Or you can look at these bottom two graphs (predicted ballots & ballots)
— Or you can look at the black curve. (registrations)
25:16 – Let’s just review what they are:
— The blue curve is the population of a county.
— The black curve is who’s registered in that county.
— The red curve is who’s supposedly voted in that county.
— And the blue curve underneath is my prediction.
26:31 – Now what’s fun about these set of data is I’m going to make the prediction two different ways:
— I’m going to make the prediction based upon the population. Pretend I don’t even know who’s registered. I’m just going to make a prediction based upon the population.
— And then I’m going to make a second prediction if I did know who was registered.
26:49 – So I’m going to show you two graphs for every county. And they’re going to play… boom, boom, boom, boom… It takes about a minute to play or something like that.
— And what you’re going to be looking for is these bottom two graphs.
— And you’re going to notice that the population prediction isn’t quite as good as the registration prediction.
— But it makes sense. Because if I have to start from here to get to here I have to go through two numbers. So it’s harder to predict.
— I can go straight from there to there. That’s one way of predicting. Or I can go from the black to the red.
— So I’m going to predict them both ways for you.
27:22 – Prediction video. (88 slides)
— So this is all of them. And I know it’s a lot. But I just want you to see that every county is predictable two ways.
— Now I have been doing this across the country. And what I like to do is I like to get the data for a particular state; and do all the analyses; and then we release it in the state and people get all freaked out. And they say “Hey, we got a problem.” Yea, you got a problem.
27:55 – And then I’ll come out there and I’ll meet the supermoms and we have a few events. I meet with a few key legislators. We plan our event.
— A couple weeks later there’s a big event. The public is all worked up about it and we have a movement going.
28:11 – Right now I’ve done that in 13 states in person and I’m working with 30 total states. Our supermoms are kicking butt I tell ya.
28:33 – (Colored map of the U.S.)
— Alright, so here’s the thing. I’ve explained this to you. Now this is really just a top level analysis. I’ve got all kinds of other analyses that go down… In fact, I’ve got analyses that will take you right down to the precinct level and you can knock on doors and find phantom voters.
-But this just gives you the overall view so you kind of know what’s happened.
29:09 – (Responds to a question.) That isn’t what these predictions are. Keep in mind, to predict them I have to be able to get in the minds of the people who decided ahead of time what they wanted the outcomes.
— It’s not as easy as you think because sometimes the people getting elected are… you wonder, why would they elect that… you know… That’s a whole other discussion. Which we need to have that discussion.
29:35 – Okay, so I’ve just explained to you how our elections are being stolen. Now how do you explain this to your friends.
— It’s hard without the graphs.
— So I told you about rolling a die 83 times.
— Here’s another way to explain it to your friends and I developed this metaphor with my supermoms.
29:50 – Blonde Hair Analogy
— Let’s say you’re in the state of OH. Imagine you’re in the state of OH. Easy to do for the ladies in my state.
— And let’s say the 2020 census just came out. And you look at it and it says that 10.0% of the people in your county have blonde hair.
— And then you go to the next county over and you look at the 2020 census and it says 10.0% of the people there have blonde hair.
30:33 – And that’s a little puzzling because you’re Amish and they’re Mexican. You know as a county it’s kind of strange that they would be exactly the same percentages.
— But you keep looking around the state and every single county has 10.0% blonde hair.
— That just doesn’t make sense does it. You would think something is wrong with that.
30:52 – So you look at the next state over. You look at PA. And 13.4% of the people there in the very first county have blonde hair.
— Now wait a minute. Everybody in OH was 10.0%, but now suddenly it’s different?
— And every county in PA is 13.4%?
31:10 – So you go to FL and now every county there is the same but different than the previous. You know something is wrong with this don’t you.
— You go over to CO and it’s a new percentage, but every county has the exact same percentage of blonde hair.
31:23 – You know that can’t be right. You know that it’s being decided at a state level and controlled at the county level. So that’s a way to explain that.
31:33 – But it’s worse than that really. Because you remember that 10.0%?
— Imagine if that was just for 18 year olds. What if you have a different percentage for 19 year olds; and a different percentage for 20 year olds; and a different percentage for each age all the way up to 100.
31:51 – And they were all the same in every county and state.
— And it didn’t matter whether you were in a large county, small county, urban county, rural county, black county, white county, green county, doesn’t matter…
— The same percentages in every one. You know that isn’t real. That’s not natural.
— So that’s a simple way for you to explain to your friends. Just use the blonde hair analogy.
32:14 – Now the reason I’m going around the country is cause I’m a firm believer in the people. If they’re given the truth, they can be depended upon to meet any national crisis.
— Is this a national crisis? Yea, I think we just lost our country.
— Mr. Lindell in the movie Scientific Proof… We did that together… About 15 minutes in he said “It’s a good thing that we lost the election or we wouldn’t know we lost our country.”
— I wouldn’t have even have looked at this. That’s another Divine appointment.
32:42 – The great point is to bring them the real facts. And bringing them the real facts is what I’m trying to do and what Mr. Lindell is doing.
— Now the problem is I learned the bitter lesson that legislatures aren’t going to save us.
— I learned the bitter lesson that our legal system isn’t going to save us.
— No one is coming to save us. We are the people we are waiting for.
33:10 – And if I’ve learned anything from last year, politicians don’t start parades they join them. So you have to be the parade.
— And it’s not that the politicians are evil, its they need you. They’re good politicians who need you to start the parade and need you to be in the parade… need to build the parade so that they can accomplish their legislative agenda.
33:36 – I’ve seen several politicians here this week and they’re going to be heroes, but we need to equip them and we need to start the parade for them.
-So that’s what I’m doing. I’m going around starting parades.
33:47 – So I’m a physicist, so I like to use metaphors. So let’s pretend that this piece of aluminum… just a piece of aluminum. This is United States… this piece of aluminum.
— And here is me spreading the truth. That’s not the microphone working, that’s really annoying like that. And I can make that really loud and really annoying. It’s kind of annoying. And it’s all pervasive.
34:21 – So this is America. This is the truth resonating in America. We just have to make it really annoying. We just have to make it unbearable. We just have to keep getting louder and not let them silence us.
— So that’s it.
“Why The MyPillow Guy Could Be Dangerous To Democracy”
The Atlantic’s Anne Applebaum joins Morning Joe to discuss her latest piece on MyPillow CEO Mike Lindell and why she writes he is a ‘clear threat to the nation.’
Only ‘threat to democracy’ is MSNBC and their propaganda/facts of omission which promote their Communistic View Points. Threat to Democracy is a democommie code phrase dog whistle. Do not click on this link.
And don’t forget MSNBC is owned by Comcast.
Comcast is predictive…Communist Castigation…the Marxist suppression of free speech, you see it everywhere in the MSM.
I was finished with ‘The Atlantic’
Your handle is a little creepy.
David Duchovny’s character in Zoolander, worth a watch
This is the corrupt leftist msm narrative (remember leftist narratives have no truth just pure propaganda) that will play repeatedly 24/7 that Mike Lindell, President Trump supporters and We The People are a “clear threat to the nation”! Lawfare can gin up Federal charges against anyone! Wouldn’t surprise me that Mike Lindell gets an early morning raid by the FBI similar to Roger Stone and arrested for incitement (free speech is under attack by the AG and deep state)! How will this truth get out to the lofo voters as to what really happen? That I don’t know. Perhaps through ballot audits by the States? How can this or any country survive nearly half of the country are deemed to be enemies of the State? God help us! Hosanna!
Bubby, you make me laugh everytime.”God help us! Hosanna!”You are right , of course.
“Be still and know that I am God. Exalted among the heathen,. Exalted among all the earth.”
Ah yes, Anne Applebaum:
‘Top Deep State Propagandist Behind Russia Hoax – Now Pushing for New Rules to Rid Internet of Opposing Voices’
https://www.thegatewaypundit.com/2021/03/revolver-news-top-deep-state-propagandist-behind-russia-hoax-now-calling-power-players-rid-internet-vocal-opposition/
She’s a covert intelligence conduit.
The clear threat to our REPUBLIC are msDnc operatives driving anti-American narratives.
We are NOT a DEMOCRACY and never have been. We are a CONSTITUTIONAL REPUBLIC.
If you need further clarification, there us a great video called America: No Documents Needed put out by America Working that has a great explanation of the difference between various types of governments. I queued it up to where the explanation starts.
We have also lost our Democracy. I might add.
Yes! Article 4 Section 4
This is a superb 37 video, TwoLaine. I have lots on Agenda 21, but this is very informative for those who don’t know how it’s designed to destroy every facet of our lives.
Not only have the Marxists taken over major portions of our Govt., Society, Education, Corporate…they are doing everything at once now. The major push is on to close their deal to destroy America.
If we don’t not just fight back but defeat and eliminate them we are done!
Why yes the pillow guy is promoting freedoms and proving fraud in the 2020 elections we can have that?
Next these deplorable‘s will want to think for themselves!
Well, all 12 people watching this drivel will be a little dumber once they finish the segment.
I believe the Atlantic is owned by Jeff Bezos wife. Just like the WaPo is owned by Jeff, birdcage lining, both of them.
Steve Jobs’ widow, Laurene owns (indirectly) 70%.
Posting links to MSNBC on Conservative websites are the only way they’ll get any views.
very tricky. lol
and yes I do believe the MyPillow guy is a clear threat …. to Communists trying to take over our Country.
At this stage, the only people who say the 2020 election was fair are those who are vested in its outcome.
So you have to wonder. Why does that include the GOP. Why would the GOP be so institutionally uninterested in listening to analysis and proven numbers such as in this article.
The brazen level of cheat they had to use in 2020 was the trigger that made the rank and file conservative pressure their local/state governments to audit the vote. But this shows the problem has far larger scope and likely extends back decades. The left has been gaming the vote for as long as the GOP was complicit in letting them get away with it.
Because THEY CHOOSE who gets to be President, just as they did on 6 Jan 2021.
Just as the DNC did for Joe in the 2020 Primary and ILLary in the 2016. They won a court case against the Bernie Bros that said they could pick whoever they want, however they want, whenever they want.
It is all just an illusion.
Their overall goal is to get rid of the Electoral College, 2018 & 2020 were just temporary fixes.
listen to Dr. Shiva, he explains how the make deals… example… let Republican be givernor and give us the Senate.
OVER THE TARGET
I thought Professor David Clements; “The Vote Trafficking Parable” was awesome.
https://rumble.com/vl2qbo-mike-lindell-cyber-symposium-professor-david-clements-the-vote-trafficking-.html
https://rumble.com/c/c-632283
https://t.me/theprofessorsrecord
A must watch:
His Parable/Metaphor presentation was a brilliant prosecutorial closing argument to the State Legislators—summarizing what the symposium was about—making a strong case to audit the 2020 election in all 50 states.
He likened his conviction of a ‘Drug Cartel Hitman’ to what he projects will happen to the Election Cartel’s Hitman, Dominion. It was the Hitman’s phone recordings that convicted him.
Clements relished the possibility that the Mesa County forensic recordings recovered and being deciphered by the cyber symposium will provide the evidence to do the same to Dominion and the Election Cartel.
thank you stillwater!!
as much as i wanted to, could not afford that much overage on my data plan.?
this is great! can peruse at leisure and refer back and forth.
monumentally good job for those of us who are “cellular plan challenged”!?
thanks again!
Thank you, Sundance and thank you, Stillwater. Well done!
Forwarding to many now.
forward to who? The choir?
Send it to Mitch McConnell and Nancy Pelosi.
Thank you for this transcript Stillwater! That took some time!
Oh, but for an honest judicial system………………
Thanks, respect, appreciation, and gratitude to Stillwater. For this, and his daily posts on every Presidential open thread.
Whatever the level of sophistication our societal management technologies possess, criminals and tyrants go one step further to corrupt those tools for their own evil ends.
Whatever level of commitment patriots possess to fight for the rule of law, criminals and tyrants surpass in their efforts to maintain power and control.
Whatever degree of openness and fairness most citizens believe they apply to their daily lives, criminals and tyrants go beyond that to cheat, steal and kill.
Whatever we can imagine we can do better and fix historical tyranny, criminals and tyrants have imagined and put in place structures that ensure that we are achieving what we imagine but at the same time perpetuate their hegemony.
“Democracy” can be understood in two ways: (1) Rule by the people or (2) Control over the people. The kosmokrators of this world have been engaging in (2) for millennia.
The ethos of “America” is about exposing and defeating those criminals and tyrants: Sic temper tyrannis.
Thank you!
Of course Sundance is the Boss, but dang great assist by Stillwater. Excellent work gentlemen
thank you Stillwater
your efforts on this site are noticed and much appreciated !
Indeed….Stillwater is a gift! 😀
WOW
Is there enough ‘how to’ information out there to a hack another election?
It is almost certain that NJ Governor will be re-elected. It is probably already baked in.
Wouldn’t it be cool if someone hacked the NJ governor election (or Virginia) and Jack Ciattarelli ‘wins’? ?
What do the dimmocrats do? Concede? Claim the election was ‘stolen/hacked’?
If they claim the election was ‘stolen/hacked’, then the 2020 election was also.?
I always wondered how much money
Billionaire Goofytooth Murphy paid to win his election?
Jack is no different than Murphy! He had dinner to raise donations with Nikki Haley and the rest of the GOP traitors! Where is “Jack” defending our children against wearing masks in schools? Nowhere! It doesn’t matter who you vote for in NJ!
God help us all…
Right, who cares about either of them. Would be nice if someone messed with the election. ?
There are ‘White Hat’ hackers as well, maybe they need to get to work offsetting all this crooked Marxist take over!
I listened to this live.
Any precinct, county or State that uses these networked machines in 2022 is complicit in election fraud.
Further, no election official can personally certify an election process they cannot independently understand.
The ‘only’ solution for 2022 is ID checked, double blind hand counted paper ballots at the precinct level.
We have about 170,000 nation wide with about 500 to 1000 registered voters each.
The hand process above would take just a few hours for a team of four people.
Results would then be submitted and published on the web so each Precinct could verify independently the published results.
We need to press this solution nationwide with what remains of honest Representatives in our States, Counties and Precincts.
Consider all those that don’t as complict in the fraud.
Networked is but one issue. The real primary crime is the up front baking the voter rolls with fake voters. Once that is done the majority of the work is done automatically with the Algorithms in the crooked Dominion software. The network connectivity is just to correct their mistakes. Remember on election night when the counting stopped all over the US for several hours? That was because the Algorithms with baked in fake voters didn’t overcome Trump’s voters…then the hackers had to stop the count and “Reassign” votes from Trump to Biden…it was very OBVIOUS if one looks at the pre shutdown and restart…magically Biden got a huge bump and took the lead. That is SO Crooked and obvious I have to assume the Fix wasn’t just in, it was cast in stone with Democraps and RINO’s all in agreement.
Very clear and well done! I learned even more.
The data Dr. Frank used was freely available in every county (some places did have fees) but now you can’t get it. Our county chair can’t get it. We want it so we can sort on “seldom voters” and go to those addresses and see if there are real voters there or not.
So, it’s FOIA time ladies and gentlemen! This is the first step in the National Election Integrity Association method:
https://neia.us/
I watched all 3 days. Thank you for posting this. The read is even more intriguing. Zuckerberg, Happy Faces, Perkins/Coie Law, Ben Whites/Lawfare, Dominion, and John Podesta-Center for American Progress? Your all on notice.
Steelman…I watched all 3 days too! I thought I was the only one to watch all 3 days from beginning to end. ? Thank you Sundance posting them here to so we can review and really absorb all the information that was given to us. I also want to thank Mike Lindell for doing this and putting himself out there for America! May God bless America and all those that want to protect her.
Me too—all 3 days—So what can be postulated from Dr. Frank’s brilliant findings?
The Democrat Party has taken their historical narrative—being the people’s Party—and embedded it in voter registration files. By keeping the dead alive, the moved in place or by inventing voters via the census, they have captured them all as an algorithm, then brought them to the polls (virtually) at election time. Why?
Absent a popular candidate like Barack Obama, one can deduce they don’t show up at the polls to vote. Keeping by-mail (absentee) voting becomes the necessary tool—the antidote to losing voters—and a cover for staying in power.
The registration records only Inflate; they hardly diminish. So while their Party activist numbers are a minority—loud but few, magnified by media—a good number of their constituents are indifferent or disappointed with the divisive issues and the lousy candidates they produce. Witness the enthusiastic crowds that filled the white circles at Joe Biden rallies.
This is what appears to be happening for a while now, especially in Pennsylvania, corroborated by Dr. Douglas Frank’s and Captain Seth Keshel’s statistical input.
You can say, in 2020, two separate elections took place in Pennsylvania.
If you want to observe where a free and fair election took place in the US 2020, I believe you can probably find it in Pennsylvania. Yes, Pennsylvania, but it occurred only within the Election Day in-person tabulation of votes—no mail ballots included and no algorithm applied. It counted only the people who put on their shoes and socks on Election Day and went to the polls, properly identified themselves, signed the books, and voted in person.
When you isolate the in person vote, Trump won every County in Pennsylvania with the exception of Philadelphia County where he only lost by a 2.5 to 1 margin—not bad when you look at the 12 to 1 margin he lost by in the by-mail tally in Philadelphia. When you compare the 2016 Pennsylvania vote, which likely contains an old algorithm, to the 2020 vote, it is possible that up to and more than 1.6 million votes were algorithmically manipulated. Biden’s in person tally was near 1.3 million while his by mail tally was a whopping 2.1 million.
Best site anywhere. So many smart people here. Thank you Sundance and thank you Stillwater. This makes it so much easier to share the information. I can check and double-check to make sure I heard correctly and didn’t miss anything.
“Pay attention to what happens next. And remember, I have never been one for hyperbole… I promise you will not be disappointed. The truth wins…. It always wins.”
https://t.me/theprofessorsrecord
We must fight! 1) We need the “The Key” to every state/county. Its simple: Ballots Returned (by age 18-101) )/Registered Voters (by age). With that single number (for each age) you can now predict with 99% accuracy the returned ballot in every county in your state (for each age). Contact your county GOP or activist organizations with Voter Registration Files, and get them on board. Get your county’s voter registration file and calculate it yourself if necessary.
2) Confront local officials with these fraud proofs. Call Media. The Election Integrity movement will gain steam. Truth will prevail. We will win. But we must fight!
The real issue is WHO is in charge of the voter rolls/registration…that is where the real CRIMINALS work!
I remember a guy on twitter (can’t recall his name) who called out something like this (algorithm being used) a few weeks after the election and how a couple East Coast states, mainly Florida, went to Trump which they hadn’t planned on which meant their algorithm for Florida was off. By the time FL was called for Trump later in the evening they realized they had missed a big target and had to key in on the other 4-5 swing states which resulted in the counting being stopped in the early hrs of the morning w Trump ahead in each state. To many Trump votes surpassed their predetermined fake algorithm so plan B fake mail in ballot scheme was initiated.
Certainly a labor of love, thank you Stillwater.
test
This is a fantastic presentation. I watched the entire 44 minutes.
One thing I WOULD like to see. He says the 2010 census was used because the 2020 census wasn’t ready. I would imagine it is , by now. I would like to see him plug in the same algorithms to the 2020 census and see how ‘off’ it would be. This might help the sceptics.
Seth Keshel Highlights Obvious Election Fraud In Erie County , PA
https://rumble.com/vl5pup-seth-keshel-highlights-obviouse-election-fraud-in-erie-county-pa.html
Correct link:
https://rumble.com/vl5rnp-seth-keshel-highlights-obvious-election-fraud-in-erie-county-pa.html
Thank you Sundance ~ 🙂
And thank you, Stillwater. Treepers like you are one of the reasons we all keep coming back.
smh My goodness, all the work…you’re a better person than I!
Thank you jeans2nd… though I’m not better that anyone else. I just have a small/narrow niche that comes in handy every now and then.
Now, if you ask me to do door-to-door canvasing, get involved in street protests, be vocal at local school board meetings, or even spread info around to a lot of contacts… I’m not the person to go to.
We each have the little things we can do given our inclinations/personalities/talents. I just stay in my little corner, keep plugging away doing what I do, hoping that maybe others will be able to use the info and spread it around to a wider audience. 🙂
Now what do the voters do that fraud has been proven and the Country is being destroyed before everyone’s eye!
4:09 – Then, during the election the databases continue to be hacked and tracked.
— We’ve got several situations where, during the actual election, we were downloading the registration databases from the county levels and keeping track…
— And it’s amazing. You can see them adding voters… removing voters. Adding voters who request ballots and received ballots even though nothing has happened.
— We’ve got records of all that happening in real time during the election.
For which specific county level registration databases does Dr. Frank have this data? Saying it was everywhere is nebulous. WHERE EXACTLY WAS THIS? WHO was in charge? Naming names is the only way to create public pressure for forensic audits and prosecutions.
Dr Frank was referring to the PCAPS they had for 3009 counties, 37 TB of info. Someone did this during the election, but I’m not certain anyone ever said who exactly was capturing this data.
Naming names is also a good way for the JoeBama Regime to slap yer arse in jail.
Best to keep a mite quiet, imo.
I watched all 3 days and I feel like I never saw the p-caps for any county. I would really like to see that
Dr. Frank’s theories are at least plausible, and I want his claims to be true. If Lindell was afraid of Biden, he wouldn’t be doing any of this. It’s time for Lindell, Frank, etc., to put up real examples that confirm their grand theories. Failing to do so is killing their credibility. Dr. Frank says he has worked with multiple counties, and taken forensic images of their data. Surely out of 3009 counties, ONE of them is in a state that Trump won, that has a Republican governor, AG, and SoS, and an Elections Board that is open to verification, where a forensic audit would prove what really happened. Proving the theory worked exactly as claimed in ONE PLACE, breaks open the whole thing. If Lindell was afraid of Biden, he wouldn’t be doing all of this. As it stands, this is too much like Joseph McCarthy holding up a blank sheet of paper while he states that it has the names of 247 Communists working inside the US Government.
Dr. Frank’s theories are at least plausible, and I want his claims to be true. If Lindell was afraid of Biden, he wouldn’t be doing any of this. It’s time for Lindell, Frank, etc., to put up real examples that confirm their grand theories. Failing to do so is killing their credibility. Dr. Frank says he has worked with multiple counties, and taken forensic images of their data. Surely out of 3009 counties, ONE of them is in a state that Trump won, that has a Republican governor, AG, and SoS, and an Elections Board that is open to verification, where a forensic audit would prove what really happened. Proving the theory worked exactly as claimed in ONE PLACE, breaks open the whole thing. As it stands, this is too much like Joseph McCarthy holding up a blank sheet of paper while he states that it has the names of 247 Communists working inside the US Government.
The information used to be freely available at the county level. It was used in precincts for block walking. Your county chair would have it.
However, it is no longer easy to get because they know we are on to them and are hiding it. If we go to the addresses of seldom voters, we can find out if they were real or ginned up from the 2010 Census data. They look legit because there is an address of a former resident.
Collecting this information is vital to triggering a full forensic audit.
Apparently, Dr. Frank says he has analysis that goes deeper and can help find phantom voters. I’ve started looking a bit more for other good videos Dr. Frank has done that might be worth taking a closer look at.
28:33 – (Colored map of the U.S.)
— Alright, so here’s the thing. I’ve explained this to you. Now this is really just a top level analysis. I’ve got all kinds of other analyses that go down… In fact, I’ve got analyses that will take you right down to the precinct level and you can knock on doors and find phantom voters.
-But this just gives you the overall view so you kind of know what’s happened.
“In fact, I’ve got analyses that will take you right down to the precinct level and you can knock on doors and find phantom voters.”
I had foolish hopes that a 72 hours marathon had room for the specific facts that prove the theory. One case study of one real place with real forensic data trumps a mountain of mathematical modeling. Does Dr. Frank have a website with in depth info?
Amazing what this guy discovered. But it needs to explained in a better clearer way with actual examples that people can understand. Most people are not going to follow a hypothetical argument. Even so, the state legislatures of MI, WI, PA, GA are not going to do anything. In PA, WI, MI you have Democrat Governors and AGs so they are going to deny and block any investigations/audits. The courts are purely political and they won’t touch this. This steal was so easy to pull off, the Democrats will do it every election and they will get even better at it so it’s harder to discover. Just as in all other totalitarian leftist countries, you will never be able to remove them by voting. The vote will forever more be rigged.
Dr. Frank is simply brilliant.
This is easy to understand and makes sense of the many senseless things that “our” government has foisted on us for decades, you know, for our own good.
Thank you, Mike Lindell for bringing this brilliant man to the fore. We know they know the world knows that the election was stolen and many more elections in the past.
We need minds like this restoring our great Republic.
I know I gave a thumbs up when this was first transcribed an posted, I can now say, “Great work, time, effort you put into this, THANK you!”
This is the magic key. I wonder if he looked at 2012 and 2016 or if this is something new?
Voter Fraud, ballot stuffing, Dead voting etc. has been going on since voting was started.
LBJ won Pharr County Texas to get his congressional seat back in the 60’s…witnesses testified he was front and center managing the ballot stuffing work… This was recorded in a book ‘A Texan Looks at Lyndon” by J. Evetts Haley.
Once the Democraps figured out how to win by fraud they never looked back. As time went on they got more and more sophisticated. When computers were introduced into voting the Democraps were there to assure their fraud continued. The only way to stop them is to Delete all Voting Machines and go back to Registered/Foolproof Paper Ballots, Only Citizens vote, one time etc…
The counting stopped suddenly in 5 states to adjust the algorithm. Trump was crushing it. The thieves had no time to consider the fallout of Biden getting 150k votes in Michigan to Trump’s zero. The desperation was real.
That is something I am interested in. The algorithm was failing. They had a preplanned alternative in select counties of those states for just that occasion. (Hillary tried same, but did not have enough preplanned votes to overcome Trump. So they learned and used it against Trump again. But armed to succeed this time.) So what do those counties look like compared to the rest of those states? And were they able to restore the algorithm after the fact?
Thanks for the Transcription!
I dis-like watching video.
But, in this case, I actually did, and found the presentation to be very professional and comprehensive.
I can only hope something HUGE comes of it.
The same ‘huge’, resounding sound of nothing that we have heard from every other investigation/ lawsuit against the fraudulent election, I’m sure.
Mark Levin has championed a convention of the states for years, rightfully so.
Lindell’s symposium was effectively the first of its kind, yet Levin doesn’t go near it.
Telling.
Bongino, Hannity, Carlson, not a peep about this symposium or Dr. Frank. So, where do they really stand when it all hits the fan? Rhetorical question.
I am so glad you transcribed Dr. Frank’s presentation. I know someone who doesn’t want to watch videos because he is either listening to music or watching sports while he works on his computer. However, he is a voracious reader, even with other stuff going on in the background.
I watched most of the symposium, and in addition to Dr. Frank’s presentation, Dr. Shiva Ayyadurai’s presentation was also excellent. He has four degrees including MIT systems engineering, a Phd in biological engineering, a masters in design engineering and a BS in computer science. He is the inventor of email. He revealed the “trusted partnership” between government and big tech that was employed to silence his revelations about election fraud in his own political campaign. He filed a lawsuit and through discovery found the network through which the two work hand-in-glove illegally. There are even manuals to describe their methods. You’ll find his presentation on Rumble.
In addition, I thoroughly enjoyed law Prof. David Clements’ presentation, The Vote Trafficking Cartel. He was a criminal prosecutor before he became a professor, so he put those skills to work as if he was making his final arguments in a courtroom. You’ll also find his presentation on Rumble under the above title.
Stillwater, thanks for doing this ! God bless you.
Watching this made me curious. I saw that 353 counties in 2020 had voter registration levels OVER 100%. San Juan county in Colorado had 153% registration, so I looked at that. In 2019, the county had 728 people. 20% of that population is under the age of 18 and can’t vote. That leaves 583 people of voting age. 653 registered to vote (I got 112% registration). 571 voted. That’s a 97% turnout. These numbers are a joke! And that was just one county I looked at.
This election theft has been going on for years. Obamao and Hilliary cheated. But Hilliary was upset by the Trump factor. They didn’t expect such a massive turnout for him and so they got caught with their pants down.
The next time, they pulled out all the stops and added in an international internet scheme and a massive vote by mail fraud.
They knew it would be so massive it would take months or years to unearth and prove all the evidence. Look at how the Russian conspiracy has been buried and Hilliary’s deleted emails. They own the DOJ so can bury anything.
The system is rigged in their favor and we have incompetent, feckless, eunuchs as representatives who seem to be in place to turn out the lights.
Faith and Good works…
James 2:22
Thank you Sundance (and Stillwater), for helping to step that Dr. Frank presentation closer and closer to the mainstream information flow….
…let the truths flow…
“HIS truths are marching on…” (Hymn of the Republic)
p.s.
The transparency of
David Clements presentation
and the Colonels overview of what is going on would also be helpful – for many others. ; )
…improved awareness, helps others improve their (color within the lines) actions…
Thank you!
There are so many people who read faster than they can listen; or who have hearing difficulties.
Thank you for transcribing this
Wow
Excellent presentation. I missed some of it on Tuesday. Gives me hope that something is going to come of this.
Nice shout out Stillwater!! Way to go and thanks for this excellent work!
CNN and FOX News election coverage showed the Election Fraud
software Feedback Loop that flipped Trump votes to Biden. This
was displayed on the TV for the whole world to see.
–
The Election Fraud programmer was most likely a Foreign National.
A Foreign National who does not watch CNN or FOX News and unaware
that CNN and FOX updates Election results in Real Time on TV.
Specialized external software was designed to execute (via Internet)
the Election Fraud aided by built-in software along with phony
mail-in ballots.
Routers will show the Internet IP address of the Foreign National
who executed the Election Fraud software.
Well first Yes, I “believe” the election was stolen based solely on election totals. Does anyone truly believe that Biden got more votes than Obama and Hillary? I don’t, and history shows that result is highly improbable. Believe is that pesky preliminary term in formal logic. Like in I believe it but I don’t know it and I can’t prove it.
This from someone that was actually hired as an analyst to look into a mayoral election. And I forced a recount.
Making this short, All election computers, this means all of them, including the ballot readers MUST have NO other software other than what has been approved by state election laws – period.
In my case I found an “illegal” database program in the aggregating computer. This because reports were printed during election night and when I analyzed those, and found that there was no other way those printouts could happen. Sure enough I found the program. My first time on the 6 PM local news, which my wife recorded :).
And by the way the program was installed by a lowly programmer, wanting to verify the accuracy of the tallies, so the outcome of the election did not change. Still illegal though….
So, all this said, I KNOW what it takes to find wrongdoing in elections. And I’m sorry to say that even though I believe it indeed happened, so far I have not seen any definitive proof of that.
Makes me wonder if today’s so called analysts are up to the task…..
Thank you!
Didn’t they block Trump from doing the census even though it was due?
I would like to see the census prior to 2010 compared in the same way- to show how it shouldn’t look the same, how this type of line is not typical.
Lastly, Dr Frank says at the end to get loud, today the DHS comes out and says anyone vocal against covid protocols is a domestic terrorist. Now, if we got loud about the election they would just add that too the list. I’m just not sure what to do besides making phone calls to elected officials and sharing this info. If I’m being honest, it’s all mathematically compelling but it’s not absolute proof. Where are the p-caps? Am I the only one who feels this way?