The “Producer Price Index” (PPI) is essentially the tracking of wholesale prices at three stages: Origination (commodity), Intermediate (processing), and then Final (to wholesale). Today, the Bureau of Labor and Statistics (BLS) released April price data [Available Here] showing another 11.0% increase year-over-year in Final Demand products at the wholesale level.
Last month when looking at internal economic activity that showed a contraction in consumer purchases of goods, we said pay attention to the service side of the ledger now. Knowing people have stopped buying ‘stuff’, if people are starting to run out of money, they will cut back in the service sector (dining out, etc).
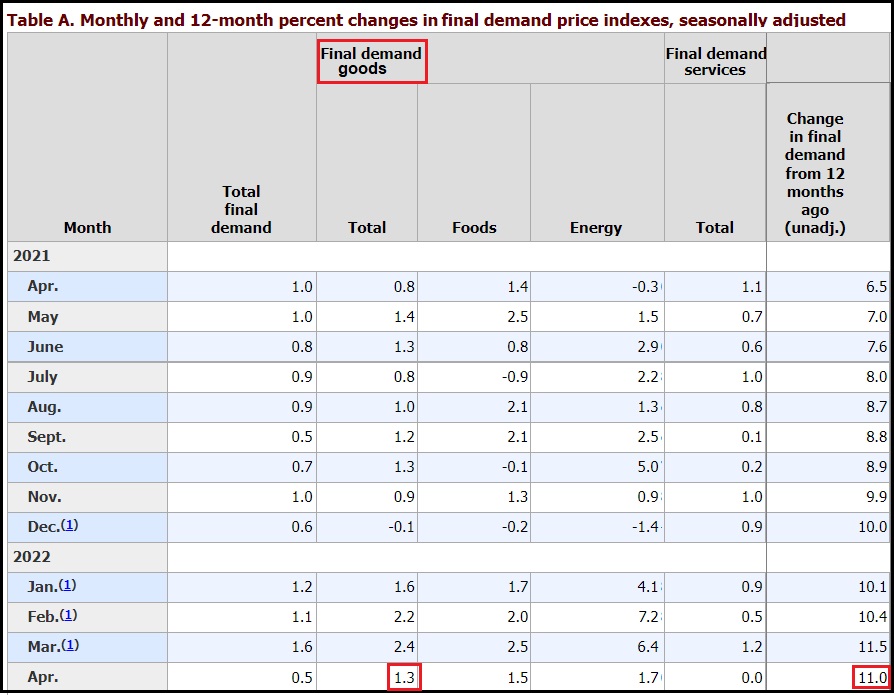
While the PPI focuses on prices, the PPI data for April shows exactly that service side contraction now taking place. Wholesale inflation in goods is determined heavily by higher costs for raw materials and processing. However, the rate of inflation within the service sector is more connected to what consumers can afford. Modified Table-A, look at the April difference between goods (1.3%) and services (0.0%):
[Ex. The lawn company might pay 50% more for oil and gasoline (goods side), but they may not be able to increase the rate they charge you by 50% to mow the grass (service side).]
The major current production inflation in both goods and services is directly connected to the cost of energy. Energy prices are embedded in every sector of the economy. For “goods” higher electricity, heating/cooling and petroleum costs (packaging, materials, transportation, etc) are unavoidable and passed on to consumers. For “services,” individuals and companies raise their prices to compensate for increases in their own costs. It is a cumulative inflation snowball.
In April the Total PPI of 0.5% was influenced by downward price pressure from the service side. The price of final demand (wholesale) goods increased 1.3%. The price of final demand (wholesale) services was 0.0%. [Note: Wholesale trade services dropped by 0.5%]
Normally I would clean up TABLE-A “intermediate demand goods both processed and unprocessed.” However, in this month the entire field of data tells a very compelling story.
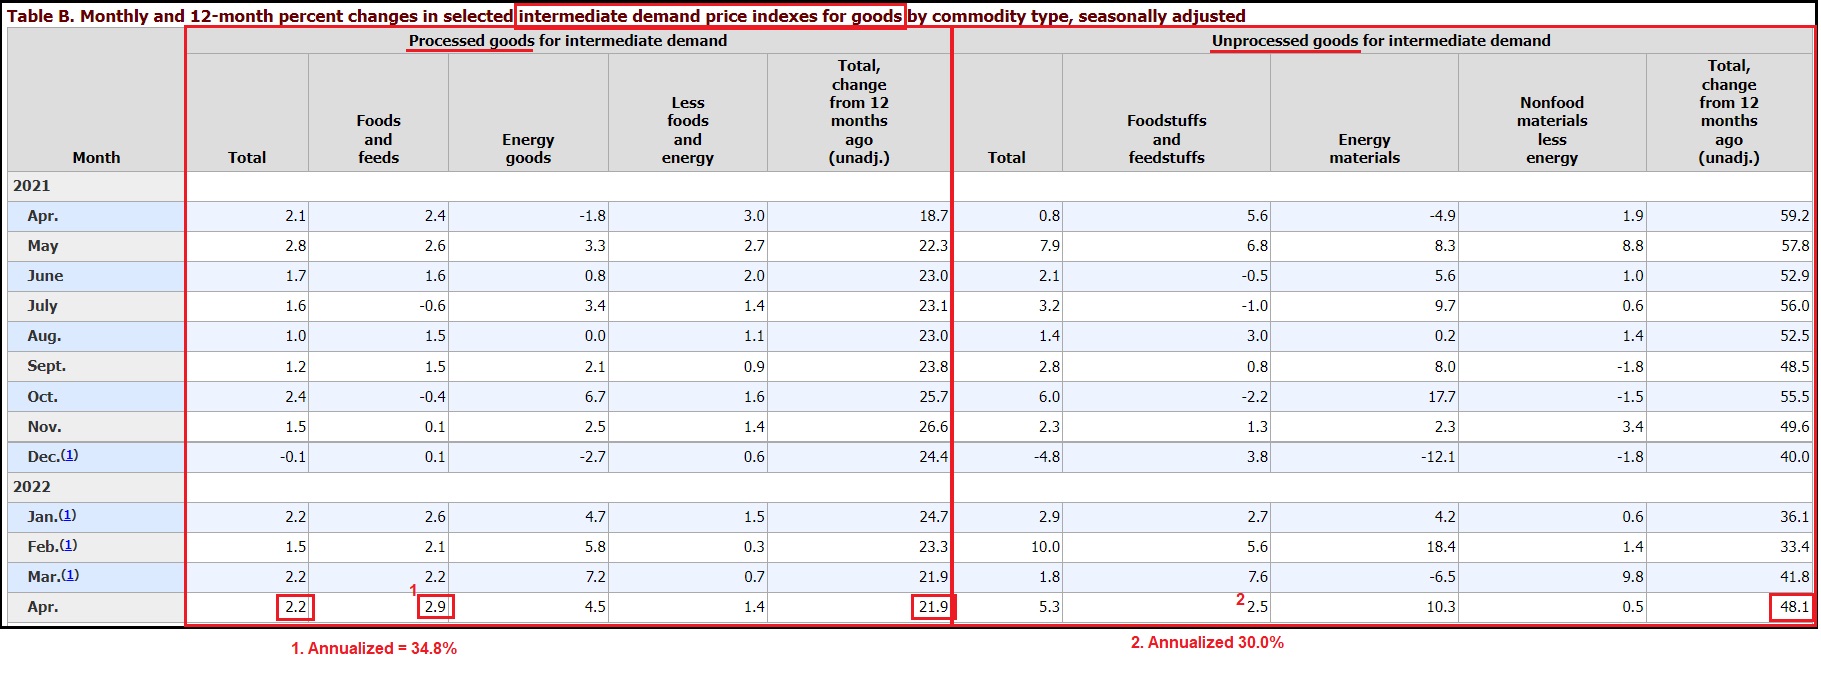
Note that Intermediate Demand Processed foodstuff prices grew at 2.9% in April. Annualized that is a 34.8% increase in price. This is the scale of future price increases we are likely to see at the supermarket. That 35% rate of inflation for center store products is exactly what CTH predicted for the third wave of price increases.
The Intermediate Demand Unprocessed foodstuffs, increased in price by 2.5% in April, those foodstuffs are entering the wholesale market at a 30.0% annualized rate of inflation vs last year.
As an analogy, think of the difference between processed foodstuffs (center store and dairy) and unprocessed foodstuffs (fresh produce, meats) as you would normally think about them in the supermarket. As you can see the processed product rate of inflation (34.8%) is higher than the non-processed (30.0%). The difference is the additional costs associated with processing as a major result of energy prices.
What the producer price index at the wholesale level is telling us, is that inflation on consumable goods is still not yet at the apex. For durable goods the prices are less volatile, but price pressures are still in the upward direction. The price of gasoline and transportation overall will be a big factor in current prices of highly consumable goods. We cannot and will not start to climb out of the inflation spiral on goods until we see oil, gas and energy prices stabilize first.
On the service side, inflation is going to be determined by how long businesses and operators can continue operations without raising prices. How long can a restaurant pay 30-to-35% more for their supplies, before those price increases need to show up on the menu?
Joe Biden sucks.
(WASHINGTON) – […] The producer price data captures inflation at an earlier stage of production and can sometimes signal where consumer prices are headed. It also feeds into the Federal Reserve’s preferred measure of inflation, the personal consumption expenditures price index.
Thursday’s figures came just a day after the government released consumer price data for April, which showed that inflation leapt 8.3% last month from a year ago. That increase is down slightly from the four-decade high in March of 8.5%. On a monthly basis, inflation rose 0.3% in April from March, the smallest increase in eight months.
Still, there were plenty of signs in the consumer price report that inflation will remain stubbornly high, likely for the rest of this year and into 2023. Rents rose faster as many apartment buildings have lifted monthly payments for new tenants. Prices for airline tickets jumped by the most on records dating to 1963. And food prices continued to rise sharply.
The Federal Reserve has stepped up its fight against rampant price increases, lifting its benchmark short-term interest rate by a half-point last week to a range of 0.75% and 1%. That increase is double its usual quarter-point hike. (read more)
Is the far Northern US still using lots of home heating oil ? As weather warms, supply should ease some lowering prices. In a normal world.
Street tamales used to be $1.25 or so. I bought some this morning, and they were $2 each and no volume discount. I don’t buy often so I cannot give an exact Biden verses Trump price.
Mmmm. Wish I lived in your zip. Even @$2, what a treat.
I bought tamales for years at $2.00 each, now they’re $4.00. Was stable price for years, many Christmas (s). In California
I am so glad I cure my own bacon. It costs me about $2.75 a pound. Bacon in the supermarket today was $10.95 a pound. What is better still is that I make english style back bacon made from the loin, not that greasy fatty rubbish Americans make from pork bellies.
I think that’s what we call Canadian bacon. Correct me if I’m wrong, but isn’t what you are disparaging known as streaky bacon or rashers?
Beef,chicken or pork Tomales are 4 for one $ USD in Yucatan, Mexico in the banana peels. Had some today.
Retired Magistrate here: Here in Central Ohio the furnace was running a couple of nights ago and will probably run a little bit through May; it still can get really chilly here at night. Starting in June and going through October don’t use fuel oil. Starting toward the middle to end of October furnace kicks on again.
Fuel oil (home heating oil) prices should be breath taking this Fall. Oh well, put on more sweaters and covers. Just received lined drapes for our big front room. Big 50 year old windows all around, like living in a tree house. However, that room gets cold so the lined drapes will help. Got a deal on the drapes-$126 for the 30 x 20 room. Will put them up this weekend to save money on air conditioning.
Have you looked at space heaters?
The radiant parabolic dish heaters are especially comfortable to sit in front of, even 15 to 20 feet away. They heat objects, not the air so the warmth is felt instantly when you get in front of it.
But they pose a fire and burn hazard, especially to pets and toddlers. You might instead consider a portable electric oil-filled radiator (Pelonis brand is common). Heat steadily and safely and use relatively few KW.
More good info. I can see I have some research to do before next fall.
Good info.
Been cold until a few days ago
When I lived in ND in the early 90s, the home we owned had a heating oil/wood burning furnace. Heating oil was expensive back then, so I was happy to feed it wood. I made a vow that I would never buy a home that was heated by an oil furnace.
Yep, I’ve been heating my historical residence in CA with a wood burning fireplace insert for about ten years. Fortunately, the drought there provided plenty of wood in the dead and dying trees on the property. Sure, the central forced air LP furnace is/was nice but it’s good to have options.
It just shifts to gasoline use. Expect a lot of stay-cation jokes as people avoid trips/travel this summer.
Temps were in the 40s and 50s last week, today its mid 80s and we need fans and air conditioning .
But then …electricity comes from the outlet on the wall right?/s
Either way the bill will go up.
Same here for temps. 90s for the last two days, and predicted for today. 60s and 70s for next week.
Just got warm enough for the furnace to stop in NW Wisconsin a few days ago. Prepay propane price in May ’21 was 1.16, prepay price Oct ’21 was 1.74. Price in March 22 was 2.59. I read about a month ago that there was only a 30 supply of propane left. Not sure if that’s true but glad it’s spring.
NE GA mtns here. Just prepaid my 500 gallons of propane for heating 2022-23 season: $3.499 / gallon. Last year 2021-22, 500 gallons prepaid at $2.499 / gallon. The parent company is Superior in Rochester NY, in what used to be fracking country.
NE GA mtns here. Just prepaid my 500 gallons of propane for heating 2022-23 season: $3.499 / gallon. Last year 2021-22, 500 gallons prepaid at $2.499 / gallon. The parent company is Superior in Rochester NY, in what used to be fracking country.
Another excellent SD analysis………..discouraging, but excellent never-the-less.
Thanks for your research and efforts.
ULTRA dittos on that comment, sir. Sundance uses DATA ANALYSIS to come to conclusions, unlike the MSM who just take a whiff of Joebama’s unicorn farts and proclaim, “Things are getting better!” No, they’re not. They’re really not.
Sometimes the truth hurts but it’s always better to know it.
I guess the other PPI,” personal pain index” has to get a lot higher before something REALLY changes…
If Republican candidates just focus on the out-of-control inflation and put other issues aside, there’s really no reason every Democrat wouldn’t be voted out of office. Maybe even out a copy of a chart like that in their business cards.
(Assuming of course that votes are counted properly.)
Its all about uniting to defeat MAGA
Frankly, F*CK “Republican candidates” who only focus on the out of control inflation and put other issues aside”, as that is the RINO approach; run a “safe” campaign.
AmericaFirst Candidates need to run on WHY and HOW we got to where we are; on how the RINOS fully participated in the failed coup attempt”Insurance policy”, the Ukraine perfect phone call SECOND failed coup attempt, and the 2020 election steal 3rd time succesful coup attempt.
And how they continue to be on board with sending Billions to Ukraine while Americans are hurting, on board with a wide open border with billions more going to aide the illegals pouring in, on board with horrible treatment of J6 peaceful protesters while leaving Antifa and BLM to riot some more,..on board with Covid mandate hoax,..
F*ck “business as usual” politics from the Republicon party, I’m am SICK of it.
respectfully,…
AGREE! Can I get an Amen?!
Amen and Amen.
Very well said.
Sounds pragmatic: let us keep quiet about “divisive” issues and we will win. The problem is that this single issue is a Trojan Horse the Uniparty uses to hide anti-MAGA candidates among Republicans. We need more tests to sort the Club for Growth crowd that is trying to remain below the radar and benefit from the MAGA movement, from the blue collar working class. At the end of the day, with the McConnell crowd we go slower to the skewer, with a better flavor and anesthesia. With the livid perverted liberals we get to wake up and fight back. So at the end of the day, we need people that will fight for freedom alongside the Deplorables, whose cause is righteous and whose good, is good for all. Your approach may be well-intended but it got us the Bushes, the Ryans, the Crenshaws, etc, etc.
Assuming the votes are counted properly and the republicans are not either being paid off or blackmailed.
Are high school graduates still able to read a simple chart?
This is going to blow-up. Grocery store clerk asked if I needed help, I asked if the prices were in USD or a foreign currency that required a calculator. I felt like I was in a foreign country, the prices of goods no longer make sense to me. Little by little I’ve had to breakdown and pay the crazy price.
I make a point of feigning shock every time I am in the store now. Today, it was onions. I said, “wow! onions have gotten so expensive!” to the produce man putting out the onions. LOL He said, “it isn’t just onions, it is everything!”
Onions are dead easy to grow. Chop out a small area of your lawn and you will have more onions than you can eat. I just harvested a lot of onions and the French onion soup and other onion heavy dishes are fantastic.
You, and we all, are in a foreign country. I’ve felt that way since I returned to it 15 years ago. The country I left was not the one I returned to.
We are having an “in moment” history lesson. Welcome to the USSA.
I hear you, Betsy. I lived in London for 9 years, then amongst British ex-pats in Spain for another 9 years. Returned in 2005. I felt like a foreigner in my own country–extreme culture shock it was. It seemed to worsen with each passing year until January 2017 when President Trump was sworn in. Finally, I thought, America had recovered from its spiraling madness. Sadly, we have relapsed and are once again running in ever-decreasing circles and will end up our own orifice.
You ARE in a foreign country. Venezuela.
RINOzuela.
Today at Wal-Mart, limes (little ones, at first I thought they were Key limes) – $1.25 ea. Used to buy them 3-4 for a dollar all the time.
Holodomor Holodomor Holodomor Come on. They aren’t even changing the script…
Maybe if we are smart enough to not let them convince us to fight in another brothers war we will come through this without it being the final nail in our coffin. Maybe our people will awaken and even take back our nations from the Bolsheviks. One can dream.
It can be done. Those who know have to speak up.
“In the case of the Holodomor, this was the first genocide that was methodically planned out and perpetrated by depriving the very people who were producers of food of their nourishment (for survival). What is especially horrific is that the withholding of food was used as a weapon of genocide and that it was done in a region of the world known as the ‘breadbasket of Europe’.”
– Prof. Andrea Graziosi, University of Naples.
https://cla.umn.edu/chgs/holocaust-genocide-education/resource-guides/holodomor
And ran three pots of water through one set of grounds in the coffee percolator .
(Ahem….! Who doesn’t save and use their bacon grease…?)
You have to be able to buy bacon to have grease to save.
All you Keurig junkies: You can make a second (weaker) mug with each K-cup you brew.
Ad rem: My paternal grandmother came to the US from Russia by shipo n 1905, and passed throug Ellis Island. My father grew up in the Bronx during the Depression. None of this behavior is unfamiliar to me! I wash and re-use foil and butcher paper, and re-used tea. Alas, turkey bacon leaves no grease behind.
I likewise had an Italian grandpa who went through Ellis Island…..and both my parents were depression kids. ‘Til the day they died, they were always waiting for the next big crash…..washed, dried, and saved everything.
Me too at the turn of the century and again during WW2. My great aunts unfortunately kept everything under the mattress. Bronx N.Y. got really bad after they started building project housing in our neighborhood.
Ditto: Maternal grands arrived via Ellis and went to an Italian neighborhood in Pittsburgh, where jobs and training were sort of guaranteed to famiglia. The economizing gene passed to me via my mom (may she rest in peace). My wife and I are well-known at the local thrift stores.
“My paternal grandmother came to the US from Russia by shipo n 1905, and passed throug Ellis Island”
Yep, same here, except maternal and during the Bolshevik Revolution (they were farmers who escaped, later staring a farm in CA), then my uncles returned to Europe to fight the Nazis and Fascists.
I keep a peanut butter jar of nails my mother used to straighten as a reminder and practice such frugality daily, even back when times were good and life was easy. When the power goes out, the oil lamps that used to light their farmhouse a hundred years ago light mine. Old habits die hard.
My paternal great grandparents also came here in 1905 from Norway on the Lusitania through Ellis Island. My grandpa was born in 1909. He and my grandma of German ancestry (born in 1920) grew up in the depression era also. Whenever one of us would complain about our jobs, my grandma would always say, “You’re damn lucky to have a job.”. One if my favorite things she made was hamburger gravy over mashed potatoes.
My grandparents came from Germany in 1885 to California. They had 9 kids. Very hard life. When I was born in 48 our whole family was self sufficient.
My mom even made our school shirts! I was working on the farm at 8 years old. Best years of my life.
Except for now. Farming in the tropics! Cheers
They found my mom! Aluminum foil was reused until it was dead.
ROFL….likewise, my mom with Christmas wrap! 😀
Even the cards To: XXXX were saved and put on presents the next year.
Ah….right. Now I remember… the Christmas cards carefully cut with pinking sheers to make the gift tags.
Your Mom, too? My Mom is a Depression baby and saves anything she can reuse. Good survival skills.
I save, wash and reuse aluminum foil, wax paper, freezer paper, even saran wrap. (Save the card board roll and rewrap papwr, foil, etc around them). Some can be reused often, others not as much.
never buy post it but with all ads save the back side that is blank, cut into 4 and use it to write notes grocery lists and for balancing checkbook
What was old is new again. It was ever thus.
I was dropping off individual baggies of cookies for a bi-weekly dinner being given out to those in need. I put the baggies in an old wax paper bag from a box of cereal because it was handy. A 9 or 10 year old kid helping with the dinner asked me if that’s what the bag was and I said yes. He looked at his mom and said that was really smart and they should do that.
Teach them young!
My in-laws were little kids growing up in London during WWII. Came to the US in their 20’s. Both still very frugal. Only recently got MIL to stop washing and reusing her foil (by telling her if she doesn’t do a perfect job some old residual food might spoil the “new” food she wrapping).
Both have been talking a lot the last few months about preparing for food rationing, and the old ration tickets their moms used. They never thought they would see what we have now here in the US – they are both astounded and disgusted at what is being done to destroy our economy and our country from within.
Poor souls. I can’t imagine living through that to find it again – now.
That is exactly what our legal immigrants from Venezuela and Cuber and Romania and Serbia are saying!
This is my mother and my mother in law. I always say that my mother could put any environmentalist to shame. She’s got the smallest carbon footprint of anyone I know.
So is it inevitable that we are going the way Venezuela went when the socialist scum took charge? Nobody on our side who has the power do do so seems to be in a big hurry to fight against this dismantling of America.
It is not inevitable.
Never, ever, let them take your guns.
Actually, while I own more than I can count, they can overcome an armed populace if the populace is rife with disunity,…
What they can NOT overcome is a populace acting in unity, even if it is disarmed.
The people of Latvia, Estonia and Lithoania were disarmed, when they acted in Unity to collectively withdraw their consent to be governed by the USSR. It took about 3 days, and the 13 fatalities were actually the triggering event, and occured just before the populace, acting en mass, said “NO! THIS far and no further, your gonna have to shoot every last one of us!”
That was the “singing revolution” and all should know the story.
Then there was the Velvet revolution in Poland, also ejected the Soviets, also did not involve guns. It used UNITY of the populace, peacefully but emphatically withdrawing their consent to be governed.
Yes, it is coordination and communication that matter, along with singularity of purpose. We have a lot of power and PDJT showed us how to use it. The rest is up to us.
There IS “nobody on our side who has the power to fight”; THATS the point.
They have manipulated the situation to where THEY have all the control.
Which makes it SEEM like they have all the Power, and “its inevitable, whats the use”.
Firstly, stop looking around or waiting for SOMEBODY else to do something.
WE must “do something”.
Secondly, do not fall for confusing CONTROL with POWER; THEY have control, without a doubt.
WE retain the POWER, but only if we act in a United fashion; that is the one thing they fear, because they have absolutely NO responce.
And so they constantly act to pre-emptively prevent Unity, by sewing division.
Restaurants are screwed. When does this hit tourist towns, hotels, etc.?
Very soon, I might not be the average person but I don’t even order takeout pizza anymore.
Oh it’s the same for most I’m sure. My household does very well (or at least most would say so, though not multiple homes well) and we’re making huge cuts all over. Number 1 place we’re cutting drastically? Eating out. Hell, the grocery store is so expensive and ever climbing that we are even buying crappier quality than ever before at the grocery store too. Even Costco is getting out of hand.
These places will eventually all go out of business (restaurants first, then grocery stores shortly afterward ) because employers aren’t ponying up to raise wages at all!! You can’t possibly run a contract based business and keep raises up to inflation.
I say all these businesses will go bye bye because you can’t have a shrinking customer base and expect to grow, and growth is the only way to stay solvent long term. In a few months every single business that depends on the existence of a middle class will be gone, non existent, just like the middle class.
Get ready, very shortly , for a world of Dollar Generals and Michelin 3 star joints only. Two extremes.
Amazon and apple will also go under in short order for they exist only for the middle class!
On target.
Dollar-And-A-Quarter General. There, FIFY.
And Domino’s is paying you $3 to pick up your own pizza. Result of too few workers and too high gas prices. Just the tip of the iceberg of the changes we are going to see in the restaurant/take out industry……
So all those folks that used to eat out will be consuming the cook at home food. Seems to me last time that happened it created a huge supply shock.
Redux
It’s already hitting around here in SE New England.
Many restaurants have adopted a reduced operating schedule, including being closed on certain weekdays, over the off season. They can’t stay open and turn a profit. They are also have difficulty finding workers.
I just got take out from a new to me restaurant, which I rarely do, but used a Groupon coupon. Their operating hours are Thurs & Fri 4-8 PM and Sat & Sun 8 AM to 1 PM. I spoke to the owner and he said they are redoing the menu now and discontinuing some things like chicken wings and revamping because food prices are so high. Sad.
Considering towing my 34′ camper to Branson is outta the question…they just got a little less from me. The Local state park, or maybe just my farm pond is my future vacation.
My best friends grandfather is to have his ashes spread in Wyoming this August. I’m adopted into the family, and would tag along nearly every time they went to the mountains there. At $1300 in diesel at current prices to get there and back, I’ve even wondered if that’s in the budget. And I’m truly middle of the middle class.
If I am making the above corrections than I am 100% positive others are too. Yet many others will continue to live in lala land until the credit cards are maxed out too. So my prediction is a mixed bag until unsecured credit runs out…. next stop, somewhere not good when the bottom falls out and people just walk away
While russian oil revenues rise by 50%.
He sure broke Putin!
Germany and the rest of Europe suicided themselves. Even this old lady could see what was coming, and now has.
The zio are throwing their entire playbook on the table. They have to know they are not going to win. This makes one wonder if the “Samson Option” may become a reality…
My former wife, from Munich, says they are expecting “WWII” living conditions and traveling by car is now a luxury.
The Ukraine puppet Zelensky is shutting off the gas pipeline to Europe. The people in Europe need to revolt as do Americans.
I’ve got to wonder if there will be elections in the fall. Hopefully, but I think they are planning something rather than face losing power or maybe they’re confident they can steal enough of them.
Putin is laughing his ass off. Russia could finish off Ukraine in a matter of days if it wanted.
Meanwhile, Putin is banking rubles and upsetting the financial order while America keeps burning billions of dollars in Ukraine and shipping our oil to europe while the middle class is being hollowed out by an administration so hell bent on trying to control the weather it is oblivious to the irreparable damage it is doing to the US.
FJB
They are hell bent on controlling us, weather is just a ploy.
The ruble today is 65 to the dollar and 67 to the Euro…..LOL! Highest ever.
So, when do the price controls kick in? You know they are coming. And then how long until we see buck naked bare shelves?
Gas lines and rationing (odd and even license plates on odd and even days if you were around in the 1970’s) is the first indicator of price controls.
Got my drivers license in ’73 and not only odd/even days to be able to buy, for awhile you could only buy $5 worth at a time. Long lines…ran out of gas a few times, IN LINE, and had to push….fun times
Those of us with personalized plates must be ska-rooooed, then.
Nope. Back in the 70s personalized plates were considered even. I know. I had personalized plates. The odd day people were lucky. Every couple of months they got two days in a row to buy gas but the even day folks never got two days in a row.
Pointing it out once more:
“Inflation” and “Shortage of Products and Services” are the direct result of “Gas Prices” which is code for “COOTUS’ Energy Policy.”
Inflation and shortages are not causing a bad economy; they are symptoms of a bad economy. That economy is bad because of “Gas Prices” which represent COOTUS Energy Policy.
Yep. The green new deal means that millions of working class citizens have to suffer on the off chance that all those idiotic policies will lower the earth’s temperature by 1/10th of one degree over the next 50 years. Meanwhile, we’re having one of the mildest springs I can remember here in my part of NC. Why should I spend 5 seconds worrying about the climate change fear mongering? It’s all just one big money grab for the super rich and I’m disgusted that the Republicans are not fighting like hell to stop these evil scum bags.
Well stated!
Respectfully, PDJT said it better. Essentially the same, except said “in about 300 F’ing years!”
LOL, …
Those promoting the “green new deal” aren’t concerned about the party’s temperature either. They’re only concerned with how they can make a profit off of it. The only green in green new deal is money.
What does COOTUS stand for (honest question)?
Current Occupant of the United States.
It rhymes with POTUS.
Well, thats the “clean” version, anyway.
And COOTUS doesn’t stand for anything, although he stumbles and drools pretty good.
It also recalls ‘old coot’, lol.
Gasoline in my little town went from $3.90 to $4.40 on Tuesday this week. Dropped to $4.20 today. Crazy!
We have a long-scheduled trip next week. It will be interesting.
Uncontested election fraud has consequences.
Uncontested that is by the supposed political opposition.
The voters they presume to represent have done a lot of contesting. But that doesn’t mean anything to RINOs.
@RandPaul is the only senator holding up the Ukraine cash giveaway.
You might think of calling his office and telling him thank you. His DC office is 202-224-4343. His Bowling Green, KY office phone is 270-782-8303.
BG KY… at one point was researching that area for future and came across…
City of Bowling Green Jobs/Part Time Positions
4/5/2022
Neighborhood & Community Services
Open until Filled
APPLICATION DEADLINE: Open until Filled The Afghan Community Navigator is a community leader who receives training to provide quality and reliable information and services for their community in an empowering and effective way. The primary purpose of the position will be connecting newly arrived Afghan individuals and families to key services under the supervision of the International Communities Coordinator. The navigator will also serve as liaison to and point of contact for, community service organizations, local non-profit organizations, and faith-based organizations in order to provide services and support for the successful integration of newly arrived Afghan evacuees/refugees to Bowling Green/Warren County. …
I propose a prisoner swap. The Taliban can have their ‘refugees’ a.k.a. soldiers back in exchange for the US citizens and Afghan aids with valid visas who were abandoned by Biden.
Amen
I haven’t had chicken wings or ribs in over a year. I have refused to pay the high prices. I can’t think of anything else though.
What have not bought recently because of prices too high due to inflation?
You can run but can’t hide, I’ve avoided the crazy prices but it is so widespread eventually they get you.
One of my local grocery stores marks down beef and other meat to ridiculously low prices the day before the label expires. I go once a week because I am always tempted to buy too much. Another store marks down bananas, apples, and pears when they have bruises or won’t sell to picky customers. I’m still eating NY strip, ribs, apple pies, banana bread, and pear preserves for less than when inflation began last year.
Favorite local pizza joint charges over $15 for a dozen smaller than average wings. More than their large pizzas with toppings. I have to imagine their supplier price is basically forcing them to charge near that amount, because that’s just insane.
So Princess Slinging Bull’s answer to this is price control. “Enact a law to outlaw gasoline price increases”. What do you think would be the result? The left likes to make the oil companies the villain, but they have no clue on how it works. Lets say a barrel of oil costs X. Half that barrel would end up fuel after the distillation process, and the other half would be feedstock for plastics and fertilizer, and all the stuff we use in a modern technological society. Distillers charge a percentage Y. For example let’s use $100 for X and 3% for Y. In that case, distillers make $3 a barrel. Of course their costs are going up too. The cost of labor, transportation, input materials other than oil, catalysts, and so on. Most of these input prices are also pegged to the price of oil. If X becomes $200 and Y is still 3%, it’s not a windfall because the other inputs consume that. Capping the price (price controls) on refined products eventually results in a situation where oil cannot be refined at a profit. That means no oil is refined and shortages.
Old folks on Social Security and babies on formula are in for some rough times. One of the Democraps said we need more abortions and in Canada they are making euthanasia available for poor people that are having a hard time surviving the inflated prices and economic downturn.
Maybe the Holley Weirdo’s can move to Canada where they can get free euthanasia.
Menu price increases are already in play the past 15 mo
Lawn guy raised rates 10%
$25.00 an hour minimum wage will fix it. /s
Most fast food franchises are already always closed now. If they move it up any more you’ll wonder whatever happened to McDonalds. My local McDs and Chik Fil A are the only ones left reliably open. The Burger King, Wendy’s, Arbys, Hardees are hardly ever open for dinner; just lunch, and the lines are so long most people leave the line after a few minutes because there is only one or two people in there working. Fast food is about to be a relic.
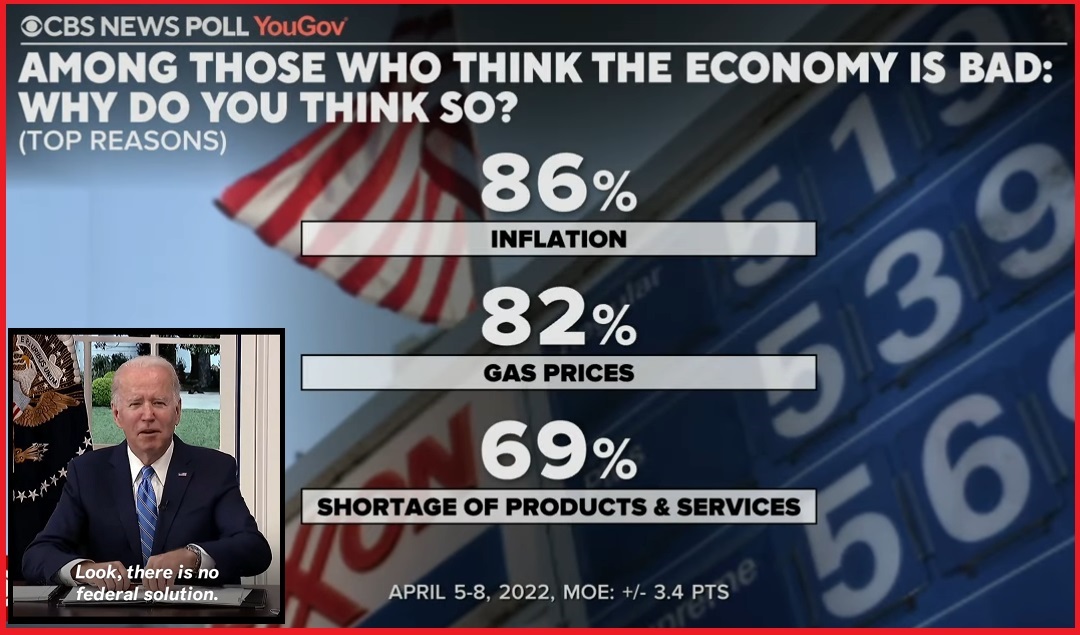
CBS News Poll You Gov
AMONG THOSE WHO THINK THE ECONOMY IS BAD:
WHY DO YOU THINK SO?
Duh…. uh…… mmmmm…….. biden?
Watch for Biden to eliminate the China tariffs imposed by Trump. That will definitely reduce inflationary pressure and the old geezer would have a legitimate policy change to tout.
We need to make this stop. I wrote my congressman (Rouzer, NC) and suggested he do something about our country having a demented and possibly criminal chief executive.
His response was that Joe is indeed a failure, but Kamala would be worse so why impeach Joe?
Then he said if Kamala were impeached then Pilosi would be president. Then if Pilosi were impeached, Schumer. So in essence he said why bother? I assume some pencil neck intern crafted the response.
I said my god that’s like refusing to excise a tumor because the next tumor might be worse. Do your f-ing duty!
And besides, if Congress were actually impeaching Biden, then the Speaker would likely be a Republican. And, exposing the affirmative action, gender/racial preference President Harris for the idiot she is might rid us of our fetish for unmerited success.
What a maroon.
After Pelosi, is NOT the Majority leader of the Senate, it is the President tempore of the Senate, also a Dem and an old geezer, but NOT Schumer.
So, your Congressman doesn’t even know the Presidential line of succession,…he IS a Maroon.
Its Patrick Leahy D-Vt, and God help us.
Then Blinken….double God Help Us.
Restaurants around us have already raised prices. The Italian place increased most items by $1 (so $13 to $14) but items like salads and cannoli were a lot more. The layer went from $3.50 to $5. We don’t buy cannoli anymore. Sandwiches have increased from below $7 to $8.85 in 2 years.
The Chinese takeout next to it reprints menus every 4 to 6 months.
Cost to mow lawn went up 8% from $60 to $65. I’m okay with this now but I hate to see what it could be in a year or two. At least he’s American and speaks English.
Haven’t bought cheese takeout in like 8 yrs. those places are ccp spy front
Lots of them got shut down by local health boards
Kentucky fried chicken wants $20.00+ for an 8 piece bucket.
I said no thanks and left.
12
Piece tenders 30 bucks
“Joe biden sucks”
Yes he does, but his puppet masters suck even worse.
“What’s happening in Sri Lanka right now (April 2022)– riots, food shortages, power cuts and more – should be a cautionary tale for political leaders who hope to get elected on populist rhetoric that has little basis in economic or agronomic reality.” Some MSM liars only referred to Sri Lanka’s “economic problems.”
President Rajapaksa and his Minister brothers forced the implementation of their own Green New Deal.
21 % of Sri Lanka’s GDP is agriculture but the Rajapaksa’s arbitrarily decided to ban all “inorganic” fertilizers and farm chemicals and only allow organic food production methods. This soon led to “a food emergency, imposition of price controls and strict rationing.” Food production was reduced by 70 % and “even the Sri Lankans had figured out food security is national security. Now the Sri Lankans will have to depend on the government – or starve.”
These unwise and reckless policies were reversed too late to prevent the chaos and the Rapaska’s still refuse to resign. Some buildings were torched and Rapaska statues knocked down during the riots.
https://www.farmprogress.com/commentary/organic-farming-policy-ended-catastrophe
Two of the houses under construction near us have stopped work. When we go to the grocery store, it is shockingly empty of people. No lines at rush hour on a weeknight?
There is a lot of pain coming, much worse than people are even feeling now. The Biden Regime will be powerless to stop Normal America from burning down government buildings in protest.
Between the shocking inflation and the shocking levels of arrogance of Republicans and Democrats helping their donors in Defense fight a mercenary war in Ukraine while Americans suffer is going to have a breaking point.
Maybe this is their plan, but I fail to see how taking a Louis XVI approach to governance and collapsing the government worked out for Louis XVI.
The biggest indicator is the highways at night, they are getting noticeably quieter.
They can’t help take that approach. It is like a force of gravity within them produced by their corrupt evil nature. Like the king they will fall equally hard, but they will continue dancing to the Minuet right until… Justice will have His day.
Food, Shelter, Water – It will come down to that for many people. Gas, fuel,food shortages severe in nature are coming, This has been done on purpose for the climate change agenda and NWO. Another Depression is coming . I was going to clean out my house and give to the Goodwill but now I’m thinking I need to keep it , help any neighbors in need, maybe, I’ll need this stuff for bartering I am not at all optimistic at all.
I’ve kept a lot of my deceased dad’s things. I can’t wear them, neither can my son. Barter came to mind….
My social security check is stretched so thin, I expect it to SNAP by the weekend.
By this time next month, I’ll be down to ketchup and hot water for soup.
F Biden and EVERY so-called Republican who licks his boots.
The college that I work for has been exempted from Social Security, so that is something that my generation of Texas professors shall not receive. Meanwhile, my 403b savings has plummeted so, I am now on the DAD retirement plan: Dead at desk.
ouch – – good luck
The attack on prosperity and energy independence continues.
How long till unemployment kicks in, in a major way?
Job shopping/shifting, as Sundance has previously discussed, can only do so much.
Soon, this dramatic drop in demand, for goods and services has got to be reflected in lower demand for workers.
The Insane Idiots In Charge are showing no signs of backing off, continueing to further restrict energy development, continueing Open Border policy, contonueing to shovel massive amounts of $ to rUkraine, and McConnell and the Rinos, GOPe and Ronna and the RNC are fully on board.
Be assured, the approved narrative inflation will never touch 10%.
The inflation line slope follows a relatively linear ascent until it all breaks loose, and then it jumps to sort of geometric then logarithmic. Adding corn, grain by grain, as a way to predict the future, assumes the future is stable, will continue unmolested its ascent. Beware that at some point–an unpredictable thing unfortunately–it breaks loose and transitions from linear to geometric to logarithmic. Sometimes a graph can present patterns not appreciated by tables. If someone has the EXCELS skills, it would be nice to keep an eye to the pattern. If any one sees a geometric rise in inflation, that may signal the wheels will soon come off–weeks to a few months before you lose your bank account. Remember, money parked in the bank, not invested in things of intrinsic value, little by little is being stolen by the government–>you can buy less with it because of the “printing press.” Keep the amount of cash in the back to a minimum, to emergency funds mostly.
Yep, the only money in my bank account is government money, a minuscule SS deposit and it’s swept out as fast as it comes in. Nothing in the financial industry at all. Everything is alternative economy, hard assets and dirt that can be defended to the death if necessary.
I was once a ‘producer’, a manufacturer of goods. I enjoyed building things and did it for a living with my own business for decades. The stench of this f*cked up society finally got to me. Done.
America is at the very early stages of inflation now. By the end of September, a lot of people will not know what hit them. They have not been paying attention. LGB shut down pipelines and has destroyed the economy chasing after Green. Strong economies run on fossil fuels. German businesses are in near panic mode due to their leaders’ Russian sanctions. The EU will suffer more than we in the USA but we will suffer also. Sanctions should never have been imposed. They are backfiring and that was predictable.
This is all due to disastrous leadership that doubles down on stupid and will not admit mistakes. Plus, of course, they may well desire this outcome. So all we can really do is plan accordingly and prepare for the worst.
“Note that Intermediate Demand Processed foodstuff prices grew at 2.9% in April. Annualized that is a 34.8% increase in price.”
To annualize a monthly growth rate, you don’t multiply by 12, you raise it to the 12th power.
So it’s worse than you think.
1.029^12 = 1.4092
40.9%, not 34.8%.
I have a simple question. If these are the true numbers, how can inflation be only 8.5% ?